
About the Fractal Trend Line Indicator
The Fractal Trend Line Indicator for MT5 draws dynamic support and resistance lines based solely on fractal points in the price chart.
It provides a clear way to visualize potential trend breakouts for both buy and sell opportunities.
The upper line acts as resistance and the lower line as support.
A candle closing above the upper line signals potential bullish momentum, while a candle closing below the lower line signals potential bearish momentum.
The indicator works across all currency pairs and trading instruments, and allows customization of base time frame, colors, and line style.
Free Download
Fractal_TL.mq5 Indicator (MT5)
Key Features
- Draws fractal-based support and resistance trend lines.
- Signals trend shifts when price breaks these lines.
- Customizable time frame, colors, and line style.
- Helps identify breakout opportunities in trending and ranging markets.
Indicator Chart
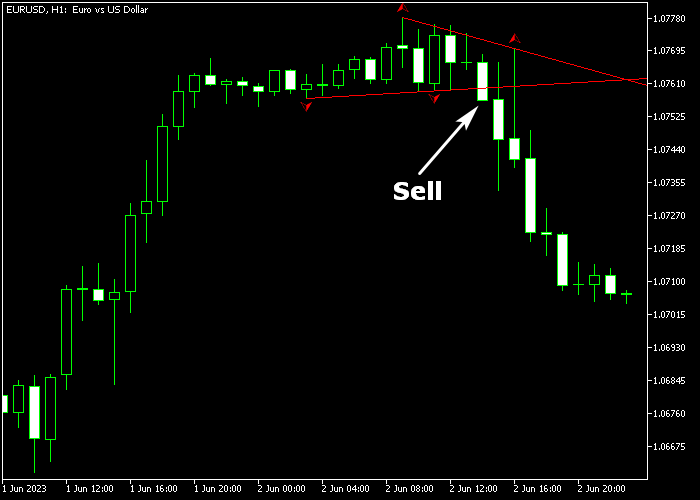
The Fractal Trend Line Indicator displays upper and lower red lines directly on the price chart.
Price closing above the upper line or below the lower line triggers potential buy or sell entries, helping traders spot trend continuation or reversals in real time.
Guide to Trade with Fractal Trend Line Indicator
Buy Rules
- Wait for a candle to close above the upper red fractal trend line.
- Ensure the breakout aligns with recent bullish momentum.
- Open a buy position at the opening of the next candle.
- Focus on trends confirmed by consecutive higher closes above the line.
Sell Rules
- Wait for a candle to close below the lower red fractal trend line.
- Ensure the breakout aligns with recent bearish momentum.
- Open a sell position at the opening of the next candle.
- Focus on trends confirmed by consecutive lower closes below the line.
Stop Loss
- For buy trades, place the stop below the most recent fractal support level.
- For sell trades, place the stop above the most recent fractal resistance level.
Take Profit
- Close buy positions if price reaches the next significant resistance or an opposite sell signal appears.
- Close sell positions if price reaches the next significant support or an opposite buy signal appears.
- Partial exits can be taken at intermediate fractal levels for safer profits.
MT5 Fractal Trend Line Breakout Strategy with Hull Moving Average HMA
This breakout strategy combines the Fractal Trend Line Indicator for MT5 with the Hull Moving Average HMA Indicator for MT5 to capture strong directional breakouts with trend confirmation.
It is designed for traders who focus on M15 and H1 charts where breakout structures tend to produce cleaner and more sustained moves compared to lower timeframes.
The Fractal Trend Line Indicator builds dynamic support and resistance levels based on fractal swing points.
The Hull Moving Average confirms trend direction.
A green HMA line signals bullish conditions while a red HMA line signals bearish pressure.
This helps filter false breakouts by ensuring trades are aligned with the broader directional momentum.
Buy Entry Rules
- Wait for price to close above the upper red fractal trend line to confirm a valid bullish breakout.
- Confirm that the Hull Moving Average is green, showing bullish trend direction.
- Enter a buy trade at the opening of the next candle after confirmation.
- Place stop loss below the most recent fractal support level or below the breakout candle low.
- Take profit at the next resistance area or close the trade when price closes back below the HMA or breaks back under the fractal trend line.
Sell Entry Rules
- Wait for a candle to close below the lower red fractal trend line to confirm a bearish breakout.
- Confirm that the Hull Moving Average is red, showing bearish market structure.
- Enter a sell trade at the next candle open after breakout confirmation.
- Place stop loss above the most recent fractal resistance level or above the breakout candle high.
- Take profit at the next support area or close the trade when price closes back above the HMA or re-enters the fractal channel.
Case Study 1: EURUSD Long Breakout Trade (H1)
EURUSD consolidated for several candles within a tight range before approaching the upper fractal trend line.
The Hull Moving Average remained green, showing that overall market pressure was still bullish.
As momentum increased, price closed above the upper fractal trend line, confirming a breakout.
A buy trade was executed on the next candle open.
Price expanded upward with strong continuation momentum, forming higher highs and respecting the green HMA line as dynamic support.
The long trade was closed when price pulled back and closed below the HMA, showing that bullish momentum was losing strength and the breakout phase was ending.
Case Study 2: GBPJPY Short Breakout Trade (M15)
GBPJPY traded sideways before building pressure near the lower fractal trend line.
The Hull Moving Average turned red, confirming bearish market structure.
Price then closed below the lower fractal trend line, triggering a valid downside breakout.
A sell trade was entered on the next candle.
Price dropped quickly with strong impulsive movement and continued lower with minimal retracement.
The short trade was closed when price retraced back above the HMA and re-entered the broken fractal structure, signaling a shift from breakout continuation to consolidation.
Download Now
Fractal_TL.mq5 Indicator (MT5)
FAQ
How does the indicator identify support and resistance?
It uses fractal points to plot the upper and lower trend lines, representing dynamic resistance and support based on recent market highs and lows.
Can it be used on any trading instrument?
Yes, the indicator works for all currency pairs and other instruments available on the platform.
Which time frames work best?
It is effective on all timeframes, but higher timeframes provide more reliable signals due to reduced market noise.
Can the indicator be used for breakout trading?
Yes, the lines act as breakout triggers. Price closing above the upper line or below the lower line signals a potential trend continuation.
Summary
The Fractal Trend Line Indicator highlights dynamic support and resistance using fractals to help traders identify potential trend breaks.
Its clear upper and lower lines make spotting bullish and bearish moves easier.
By entering trades when price closes beyond these lines and monitoring trend alignment, traders can follow momentum systematically.
Combining the indicator with a sound trading plan allows for consistent and structured decision-making.


