
About the Harami Pattern Indicator
The Harami Pattern Indicator for MT5 is designed to automatically detect bullish and bearish Harami candlestick formations on your chart.
Instead of manually scanning price action, the indicator instantly highlights these patterns with visual arrow signals.
A bullish Harami suggests a potential shift from a downtrend to an upward move, while a bearish Harami signals a possible reversal from an uptrend.
The indicator marks these opportunities with blue upward arrows for buy setups and magenta downward arrows for sell setups.
This tool helps traders react faster to market changes and improves timing when entering reversal trades.
It suits both beginners and experienced traders who rely on candlestick patterns to gauge market sentiment and anticipate turning points.
Free Download
Key Features
- Automatically detects bullish and bearish Harami patterns.
- Blue arrows signal potential buy opportunities.
- Magenta arrows indicate possible sell setups.
- Works directly on the price area for easy interpretation.
- Helps identify reversal zones without manual analysis.
- Can be combined with other tools for stronger confirmation.
Indicator Chart
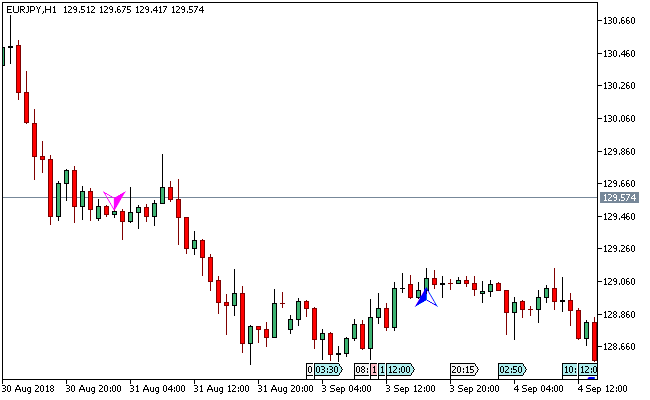
The Harami Pattern Indicator displays blue upward arrows below price for bullish signals and magenta downward arrows above price for bearish signals.
It shows where potential reversals may occur based on candlestick formations.
Guide to Trade with Harami Pattern Indicator
Buy Rules
- Enter a buy trade when a blue upward arrow appears below the candle.
- Confirm that the signal forms after a downward move.
- Look for bullish confirmation from price action.
- Avoid entry if the market lacks momentum.
Sell Rules
- Enter a sell trade when a magenta downward arrow appears above the candle.
- Confirm that the signal forms after an upward move.
- Check for bearish pressure in the market.
- Avoid entry during consolidation.
Stop Loss
- Place the stop loss 2-3 pips below the recent low for buy trades.
- Place the stop loss 2-3 pips above the recent high for sell trades.
- Keep risk aligned with your strategy.
Take Profit
- Close all buy trades when a magenta Harami arrow appears.
- Close all sell trades when a blue Harami arrow appears.
- Alternatively, use a fixed pip profit target of your preference.
MT5 Scalping Strategy Using Harami Pattern Indicator
This scalping strategy combines the Harami Pattern Indicator with the Swing Line Indicator to trade short-term reversals in momentum on M1 and M5 charts.
The Harami Pattern Indicator detects two-candle reversal formations and plots directional arrows directly on price.
A blue upward arrow signals a bullish harami setup after selling pressure slows.
A magenta arrow signals a bearish harami setup after buying pressure weakens.
The focus is on micro reversals that often appear after short impulsive moves.
The Swing Line Indicator defines short-term trend direction using a dynamic line that follows swing highs and swing lows.
A green line indicates bullish structure while a violet line indicates bearish structure. It acts as a filter to avoid trading against the immediate trend flow.
This strategy is designed for fast intraday execution across pairs like EURUSD, GBPJPY, AUDUSD, and XAUUSD during London and New York sessions.
Buy Entry Rules
- Confirm that the Swing Line Indicator is green, showing a bullish short-term trend.
- Wait for a blue upward arrow from the Harami Pattern Indicator.
- Enter a buy trade at the close of the signal candle on M1 or M5 charts.
- Place the stop loss below the most recent swing low or below the last Swing Line reaction point.
- Close the trade when a magenta arrow appears because it signals weakening bullish pressure.
- Alternative exit: close the trade when the Swing Line turns violet, indicating a bearish transition.
Sell Entry Rules
- Confirm that the Swing Line Indicator is violet, showing a bearish short-term trend.
- Wait for a magenta downward arrow from the Harami Pattern Indicator.
- Enter a sell trade at the close of the signal candle on M1 or M5 charts.
- Place the stop loss above the most recent swing high or above the last Swing Line reaction point.
- Close the trade when a blue arrow appears because it signals bullish pressure returning.
- Alternative exit: close the trade when the Swing Line turns green, indicating bullish structure forming.
Case Study 1
On GBPUSD M5 during the London session, price pushed lower in a fast move and then formed a bullish harami pattern.
The Swing Line Indicator remained green, confirming short-term bullish trend.
A buy trade was opened at candle close.
The stop loss was placed below the most recent swing low formed before the reversal signal.
Fifteen candles later, a magenta arrow appeared on the chart.
The trade was closed after the Harami Pattern Indicator signaled a shift toward bearish pressure.
Case Study 2
On EURJPY M1 during the New York session, price formed a sharp spike upward followed by a bearish harami pattern.
The Swing Line Indicator was violet, confirming a bearish trend.
A sell trade was opened at signal candle close.
The stop loss was placed above the rejection high created during the spike.
After a short consolidation, the Swing Line Indicator turned green.
The trade was closed after the indicator confirmed a shift into bullish short-term trend conditions.
Download Now
FAQ
What does the Harami Pattern Indicator detect?
It identifies bullish and bearish Harami candlestick formations and marks them directly on the price area using arrows.
How reliable are the signals?
The signals can be effective when used with trend context and confirmation tools. They perform best after strong directional moves.
Do I need other indicators with it?
While it works on its own, combining it with support and resistance or trend indicators can improve trade quality.
Summary
The Harami Pattern Indicator simplifies candlestick analysis by automatically detecting key reversal patterns.
It helps traders react faster and identify turning points without manual effort.
Its arrow-based signals make it easy to follow, especially for those focused on price action strategies.
This tool performs strongly when used in trending conditions where reversals are more meaningful.
By combining it with additional confirmation tools, traders can improve accuracy and make more confident trading decisions in different market environments.


