

About the Swing Line Indicator
The Swing Line Indicator for MT5 provides clear stop-and-reverse swing trading signals.
It works on any timeframe and shows opportunities directly on the main price chart with green and violet lines.
A green Swing Line signals a potential buy, while a violet Swing Line indicates a potential sell.
These color-coded signals allow traders to react quickly to trend reversals and short-term momentum changes.
The indicator includes customizable inputs such as line style and colors.
Traders using M1 and M5 charts may find the best results during London and New York trading hours.
Free Download
Swing_line.mq5 Indicator (MT5)
Key Features
- Green line signals buy trade opportunities.
- Violet line signals sell trade opportunities.
- Customizable line style and colors.
- Ideal for stop-and-reverse swing trading.
Indicator Chart
The Swing Line Indicator displays green and violet lines on the main price chart.
Green lines indicate potential buy trades, and violet lines indicate potential sell trades.
Traders use these signals to time entries and exits based on momentum shifts.
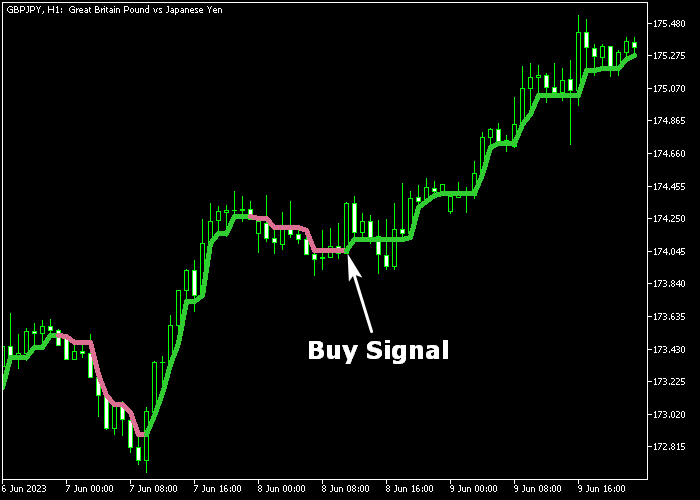
Guide to Trade with Swing Line Indicator
Buy Rules
- Wait for a green Swing Line to appear on the main price chart.
- Confirm that the price is showing upward momentum.
- Enter a buy position at the next candle after the green line forms.
- Avoid buying if the market is choppy or sideways despite a green line.
Sell Rules
- Wait for a violet Swing Line to appear on the main price chart.
- Confirm that the price is showing downward momentum.
- Enter a sell position at the next candle after the violet line forms.
- Avoid selling if the market is choppy or sideways despite a violet line.
Stop Loss
- Set stop loss below swing support for buy trades.
- Set stop loss above swing resistance for sell trades.
- Trail stops as the trade moves in your favor if desired.
Take Profit
- Close buy trades when a violet Swing Line appears.
- Close sell trades when a green Swing Line appears.
- Alternatively, use a predefined profit target for your strategy.
- You can scale out partially at key support or resistance levels.
Swing Line Indicator and Universal Forex Oscillator Strategy for MT5
This strategy combines the Swing Line indicator with the Universal Forex Oscillator to create a reliable trading approach for M15 and H1 timeframes.
The Swing Line indicator follows price closely and changes color to reflect short term trend direction, making it useful for identifying shifts in market structure.
The Universal Forex Oscillator adds momentum confirmation through its cloud signals, helping traders avoid weak entries and focus on high probability setups.
This method focuses on trading in the direction of the current trend while using the oscillator to confirm strength behind the move.
It works well for intraday and short swing trades, allowing traders to stay in positions longer than scalping strategies while still reacting quickly to reversals.
Buy Entry Rules
- Enter a buy when the Swing Line turns green, indicating a bullish trend.
- Confirm the entry when the Universal Forex Oscillator shows a blue cloud.
- Open the trade at the close of the confirmation candle.
- Set a stop loss a few pips below the recent swing low.
- Take profit when the Swing Line turns violet or the oscillator cloud turns red.
Sell Entry Rules
- Enter a sell when the Swing Line turns violet, indicating a bearish trend.
- Confirm the entry when the Universal Forex Oscillator shows a red cloud.
- Open the trade at the close of the confirmation candle.
- Set a stop loss a few pips above the recent swing high.
- Take profit when the Swing Line turns green or the oscillator cloud turns blue.
Case Study 1: AUD/USD Bullish Continuation
On a 15-minute AUD/USD chart, the Swing Line turned green as price began to trend upward.
Shortly after, the Universal Forex Oscillator formed a blue cloud, confirming strong bullish momentum.
A buy trade was opened at the close of the signal candle with a stop loss placed below the recent swing low.
Price continued to rise steadily as both indicators remained aligned.
The position was closed when the oscillator cloud shifted to red, capturing a clean intraday move.
Case Study 2: GBP/JPY Bearish Reversal
On a 1-hour GBP/JPY chart, the Swing Line changed to violet, signaling a shift to bearish conditions.
At the same time, the Universal Forex Oscillator displayed a red cloud, confirming increasing selling pressure.
A sell trade was entered at the candle close with a stop loss above the recent swing high.
Price moved lower with strong momentum and respected the trend direction.
The trade was closed when the Swing Line turned green again, which indicated a bullish trend reversal.
Download Now
Swing_line.mq5 Indicator (MT5)
FAQ
Does the Swing Line Indicator work on all timeframes?
Yes, it works on any timeframe, but lower timeframes like M1 and M5 perform best during active London and New York sessions.
Can I change the line colors and style?
Yes, the indicator allows full customization of line colors and style to match your chart preferences.
How do I know when to exit a trade?
You can exit when the opposite colored Swing Line appears, or set a personal profit target according to your strategy.
Is the indicator suitable for swing trading?
Yes, it is specifically designed for stop-and-reverse swing trading and helps capture short-term trend reversals effectively.
Summary
The Swing Line Indicator delivers actionable swing trading signals with green and violet lines directly on the chart.
It helps traders identify trend reversals and manage entries and exits efficiently.
With customizable line styles, colors, and session awareness for lower timeframes, it enhances precision and workflow for active traders.
Combining it with sound risk management ensures reliable swing trading performance.





