
About the Ichimoku Alert Indicator
The Ichimoku Alert indicator for MT5 is a simplified trading tool based on the well-known Ichimoku Kinko Hyo system.
Instead of displaying all Ichimoku components, this version focuses only on the Tenkan-sen and Kijun-sen lines to generate straightforward trend signals.
The indicator draws two lines directly on the price area. The red line represents the Tenkan-sen while the blue line represents the Kijun-sen.
These two lines interact with each other and create crossover signals that traders use to identify potential trend changes.
A bullish trend signal appears when the red line crosses above the blue line from below.
This movement suggests that short-term momentum begins shifting upward.
A bearish signal appears when the red line crosses below the blue line from above, indicating that downward momentum may start developing.
The indicator does not repaint its signals, which means once a crossover appears it remains fixed on the chart.
Free Download
IchimokuAlert.mq5 Indicator (MT5)
Key Features
- Simplified Ichimoku system focusing on Tenkan-sen and Kijun-sen lines.
- Generates buy and sell signals based on crossover events.
- Displays two signal lines directly on the price area.
- Non-repainting signals once a crossover is confirmed.
- Adjustable Tenkan-sen and Kijun-sen parameters.
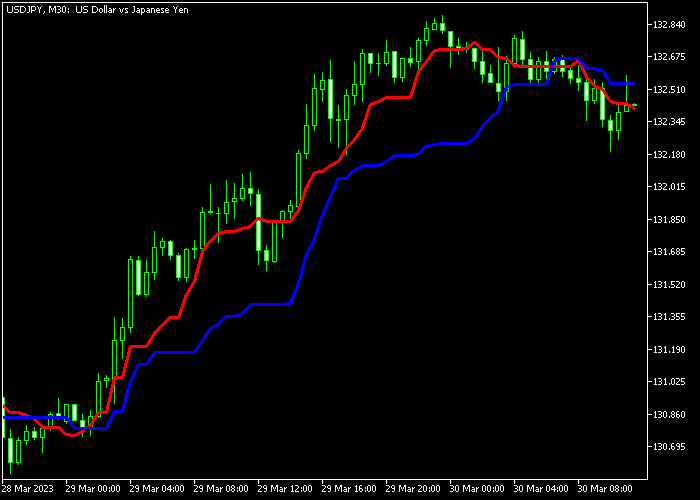
Indicator Chart
The Ichimoku Alert indicator displays two lines on the price area that represent the Tenkan-sen and Kijun-sen values.
Traders monitor the crossovers between the red and blue lines to identify potential buy signals during upward momentum and sell signals when downward momentum begins to build.
Guide to Trade with Ichimoku Alert Indicator
Buy Rules
- Watch for the red Tenkan-sen line to cross above the blue Kijun-sen line.
- The crossover must occur from below to confirm a bullish signal.
- Open a buy trade once the crossover is completed and the candle closes.
- This signal indicates that upward momentum may begin developing.
Sell Rules
- Wait for the red Tenkan-sen line to cross below the blue Kijun-sen line.
- The crossover must occur from above to confirm a bearish signal.
- Open a sell trade once the crossover is confirmed.
- This condition suggests that the market may start moving downward.
Stop Loss
- Place the stop loss below the most recent support zone for buy trades.
- Place the stop loss above the nearest resistance level for sell trades.
- Risk management should always remain consistent across trades.
Take Profit
- Close the buy trade when a new bearish crossover appears.
- Close the sell trade when a new bullish crossover appears.
- Traders may also use fixed reward targets depending on their strategy.
- Support and resistance levels can provide additional exit targets.
MT5 Jurik Moving Average Indicator Scalping Strategy
This strategy combines the Jurik Moving Average Indicator with the T3 Moving Average Alarm Indicator to create a fast scalping approach for Forex day trading.
The Jurik Moving Average defines market direction in a smooth way with reduced lag.
When price is above the line, the market is treated as bullish. When price is below, it is bearish.
The T3 Moving Average Alarm provides entry timing using blue arrows for buys and red arrows for sells, giving clear entry confirmation after trend direction is set.
This strategy works well on M1, M5, and M15 charts.
It is used for active sessions where price moves frequently and short-term structure is clear.
Buy Entry Rules
- Confirm price is above the Jurik Moving Average.
- Wait for a blue arrow from the T3 Moving Average Alarm indicator.
- Enter a buy trade after the signal candle closes.
- Place the stop loss below the Jurik Moving Average or recent swing low.
- Close the buy trade when a red arrow appears from the T3 indicator or when price closes below the Jurik Moving Average.
Sell Entry Rules
- Confirm price is below the Jurik Moving Average.
- Wait for a red arrow from the T3 Moving Average Alarm indicator.
- Enter a sell trade after the signal candle closes.
- Place the stop loss above the Jurik Moving Average or recent swing high.
- Close the sell trade when a blue arrow appears from the T3 indicator or when price closes above the Jurik Moving Average.
Case Study 1: EURUSD M5 Scalping Trade
On the EURUSD M5 timeframe, price moved above the Jurik Moving Average, confirming bullish conditions.
Shortly after, a blue arrow appeared from the T3 Moving Average Alarm indicator.
A buy trade was entered after the candle closed. The stop loss was placed below the Jurik Moving Average.
About 50 minutes later, a red arrow appeared from the T3 indicator.
The buy trade was closed at that moment based on the opposite signal from the T3 Moving Average Alarm indicator.
Case Study 2: GBPJPY M1 Fast Trade
On the GBPJPY M1 chart, price stayed below the Jurik Moving Average, confirming bearish pressure.
Two candles later, the T3 Moving Average Alarm indicator printed a red arrow.
A sell trade was entered after confirmation. The stop loss was placed above the Jurik Moving Average.
Around 8 minutes later, price closed above the Jurik Moving Average.
The sell trade was closed at that point based on the Jurik Moving Average indicating a trend shift.
Case Study 3: AUDUSD M15 Intraday Trade
On the AUDUSD M15 timeframe, price broke above the Jurik Moving Average and stayed stable above it.
After 3 candles, a blue arrow appeared from the T3 Moving Average Alarm indicator.
A buy trade was entered after the signal candle closed. The stop loss was placed below the Jurik Moving Average.
Roughly 2 hours later, a red arrow appeared from the T3 indicator.
The buy trade was closed immediately based on the T3 Moving Average Alarm switching direction.
Download Now
IchimokuAlert.mq5 Indicator (MT5)
FAQ
What makes this indicator different from the full Ichimoku system?
The full Ichimoku system includes several components such as the cloud, lagging span, and leading spans.
This indicator focuses only on the Tenkan-sen and Kijun-sen crossover signals to simplify trading decisions.
Which settings can be adjusted?
The indicator allows traders to modify the Tenkan-sen and Kijun-sen parameters. Adjusting these values changes how quickly the lines react to price movements.
Can beginners use the Ichimoku Alert indicator?
Yes. The simplified design makes it easier to understand compared to the full Ichimoku system.
Beginners can focus on crossover signals while gradually learning broader Ichimoku concepts.
Summary
The Ichimoku Alert indicator offers a simplified approach to using Ichimoku signals in trading.
By focusing on the Tenkan-sen and Kijun-sen crossover, the indicator highlights potential trend changes without overwhelming the trader with multiple components.
The two-line system makes it easy to monitor bullish and bearish momentum directly on the price area.
Traders can quickly spot crossovers and react to emerging market direction.
Overall, the Ichimoku Alert indicator can serve as a practical addition to many trend-following trading strategies.


