
About the Instantaneous Trendline Levels Indicator
The Instantaneous Trendline Levels Indicator for MT5 follows the most likely market direction at any moment and highlights bullish and bearish phases directly on the trading platform.
It analyzes price movement and plots colored zones that reflect whether buyers or sellers currently dominate the market.
The indicator uses a calculated trendline model that reacts quickly to price shifts.
When bullish momentum strengthens, a green filled zone appears beneath the main price area.
When bearish pressure increases, a violet filled zone takes its place.
These zones help traders quickly identify the current market bias.
Traders often use this tool to time entries in the direction of the prevailing trend.
It can operate as a standalone trading indicator or alongside other tools such as moving averages, oscillators, or support and resistance levels.
Because it focuses on trend direction and momentum shifts, it works well for both short-term trading and longer market analysis.
Free Download
Instantaneous trendline levels.mq5 Indicator (MT5)
Key Features
- Displays bullish and bearish zones based on real-time trendline calculations.
- Highlights green filled zones during bullish market conditions.
- Shows violet filled zones during bearish market conditions.
- Helps traders follow the dominant trend without complex analysis.
- Works as a standalone trading indicator or combined with other tools.
- Customizable parameters including period, levels period, and price source.
- Option to enable or disable the filled zone display.
Indicator Chart
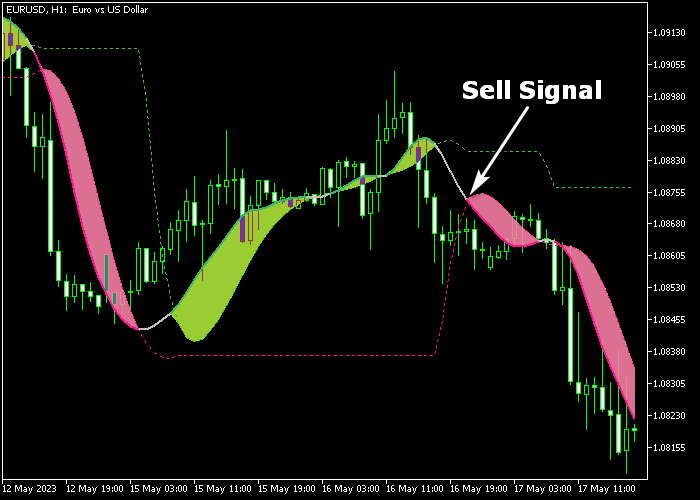
The Instantaneous Trendline Levels Indicator appears on the main price window and paints colored zones that represent the current market direction.
A green filled zone signals bullish momentum, while a violet filled zone signals bearish pressure.
Traders watch these zones to identify potential buy and sell opportunities aligned with the prevailing trend.
Guide to Trade with Instantaneous Trendline Levels Indicator
Buy Rules
- Wait for the green filled zone to appear on the main price area.
- Confirm that price begins moving in an upward direction.
- Enter a buy position once the bullish zone becomes active.
- Stay in the trade while the green zone remains visible.
Sell Rules
- Wait for the violet filled zone to appear on the main price area.
- Confirm that price begins moving downward.
- Enter a sell position once the bearish zone becomes active.
- Remain in the trade while the violet zone continues to display.
Stop Loss
- Place the stop loss a few pips below the entry price or support for buy trades.
- Place the stop loss a few pips above the entry price or resistance for sell trades.
Take Profit
- Close the buy position when the green zone switches to a violet zone.
- Close the sell position when the violet zone switches to a green zone.
- Alternatively, exit near important support or resistance levels.
Instantaneous Trendline Levels and MACD Divergence Forex Strategy for MT5
This strategy combines the Instantaneous Trendline Levels Indicator with the MACD Divergence Indicator to create a reversal-based trading approach with strong trend filtering.
The Instantaneous Trendline Levels Indicator displays a colored zone that reflects the current market direction.
A green filled zone signals a bullish trend, while a violet filled zone signals a bearish trend.
This serves as a dynamic trend filter, helping traders avoid trading against the main direction.
The MACD Divergence Indicator identifies early reversal signals by detecting divergence between price and momentum.
A green arrow shows bullish divergence, meaning selling pressure is weakening.
A red arrow shows bearish divergence, meaning buying pressure is weakening.
This strategy works best on M15 and H1 charts, where divergence signals are more reliable and less affected by noise.
Buy Entry Rules
- Wait for the Instantaneous Trendline Levels zone to turn green, confirming a bullish trend.
- Wait for a green arrow from the MACD Divergence Indicator, signaling bullish divergence.
- Enter a buy trade at the close of the confirmation candle.
- Place stop loss below the most recent swing low or just below the green zone.
- Close the trade when a red divergence arrow appears or when the zone turns violet.
Sell Entry Rules
- Wait for the Instantaneous Trendline Levels zone to turn violet, confirming a bearish trend.
- Wait for a red arrow from the MACD Divergence Indicator, signaling bearish divergence.
- Enter a sell trade at the close of the confirmation candle.
- Place stop loss above the most recent swing high or just above the violet zone.
- Close the trade when a green divergence arrow appears or when the zone turns green.
Case Study 1: EURAUD M15 Buy Setup
On EURAUD M15, the Instantaneous Trendline Levels zone shifted to green after a period of sideways movement, confirming bullish conditions.
Shortly after, the MACD Divergence Indicator printed a green arrow, signaling bullish divergence as price made a lower low while momentum weakened.
A buy trade was entered at the close of the signal candle.
The stop loss was placed below the recent swing low and just under the green zone.
Price moved upward steadily with small pullbacks.
The buy trade was closed when a red divergence arrow appeared, indicating potential reversal.
Case Study 2: USDCHF H1 Sell Setup
On USDCHF H1, price rejected a resistance level and the Instantaneous Trendline Levels zone turned violet, confirming bearish conditions.
The MACD Divergence Indicator then showed a red arrow, signaling bearish divergence as price made a higher high while momentum weakened.
A sell trade was entered at the close of the confirmation candle.
The stop loss was placed above the recent swing high and just above the violet zone.
Price moved downward in a controlled trend.
The short trade was closed when a green divergence arrow appeared, signaling weakening bearish pressure.
Download Now
Instantaneous trendline levels.mq5 Indicator (MT5)
FAQ
How does the Instantaneous Trendline Levels Indicator detect the trend?
The indicator calculates a responsive trendline based on recent price data and highlights the dominant direction with colored zones.
The green zone shows bullish pressure while the violet zone reflects bearish pressure.
Which settings affect the sensitivity of the signals?
The period and levels period parameters control how quickly the indicator reacts to price movement.
Lower values make the indicator react faster, while higher values smooth the signals and reduce frequent changes.
Is the indicator suitable for trend trading strategies?
Yes. The indicator focuses on tracking the dominant market direction.
Many traders use it to follow trends and stay in trades as long as the colored zone remains in the same direction.
Summary
The Instantaneous Trendline Levels Indicator provides a practical way to monitor market direction through colored bullish and bearish zones.
These zones help traders quickly understand whether buying or selling pressure dominates the market.
The indicator reacts to price movement in real time and highlights potential trading opportunities when the market direction shifts.
This allows traders to follow developing trends without relying on complex analysis.
With adjustable parameters and flexible usage, the indicator can be applied to different currency pairs and timeframes.





