About the MA Trend Indicator
The MA Trend Indicator for MT5 converts a traditional moving average calculation into a colored trend bar system that helps traders quickly identify market direction.
Instead of displaying a standard moving average line, the indicator presents colored bars that reflect whether the market is leaning bullish or bearish.
When the market begins shifting direction, the color of the bars changes and signals a possible trading opportunity.
Because the indicator is based on moving average calculations, it follows the prevailing market trend and filters minor price fluctuations.
Short-term traders often apply it to lower timeframes, especially during the London and New York sessions when market activity is stronger.
Several parameters can be adjusted, including the period begin value, step settings, moving average method, and applied price.
Free Download
Key Features
- Transforms moving average calculations into colored trend bars.
- Blue bars highlight bullish market direction.
- Red bars highlight bearish market conditions.
- Helps identify potential trend continuation or reversal points.
- Simple visual signals directly on the price chart.
- Customizable moving average parameters.
- Often used during active trading sessions for better momentum.
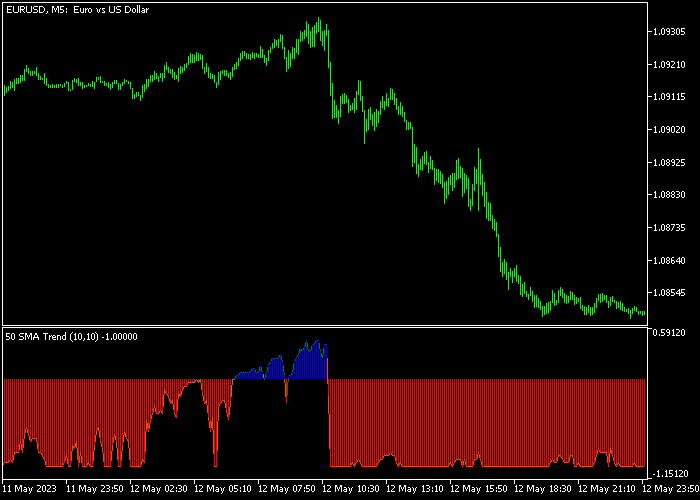
Indicator Chart
The MA Trend Indicator appears beneath the price chart as colored bars that follow market direction.
In the example, blue bars form during bullish momentum while red bars appear when the market begins moving lower, helping traders recognize potential trend shifts.

Guide to Trade with the MA Trend Indicator
Buy Rules
- Watch the price chart for the first blue MA Trend bar to appear.
- This color shift suggests that bullish momentum may be starting.
- Confirm that price begins moving upward with the new trend.
- Open a buy trade after the bullish bar forms.
Sell Rules
- Observe the chart for the first red MA Trend bar.
- This color change signals that bearish pressure may be increasing.
- Confirm that price begins moving lower.
- Open a sell trade once the bearish bar appears.
Stop Loss
- Place the stop loss slightly below the most recent support level for buy trades.
- Place the stop loss slightly above the most recent resistance level for sell trades.
Take Profit
- Close the buy trade if the indicator changes from blue to red.
- Close the sell trade if the indicator changes from red to blue.
- Traders may also trail the stop as long as the trend bars remain in the same direction.
MT5 MA Trend Indicator Forex Strategy
This strategy combines the MA Trend Indicator with the Super Arrow Buy Sell Indicator to create a simple and effective trend-following trading system.
The MA Trend indicator defines the overall direction of the market using colored bars.
Consecutive blue bars indicate a bullish trend, while consecutive red bars indicate a bearish trend.
This allows traders to quickly identify whether the market is trending or not and stay aligned with that direction.
The Super Arrow indicator provides precise entry timing.
A blue arrow signals a buy opportunity, while a red arrow signals a sell opportunity.
These arrows are designed to highlight short-term momentum shifts and give clear entry signals directly on price.
This combination works well on M1, M5, and M15 charts during the London and New York trading sessions.
Buy Entry Rules
- Confirm that the MA Trend indicator shows consecutive blue bars, indicating a bullish trend.
- Wait for a blue arrow from the Super Arrow indicator.
- Enter a buy trade at the close of the signal candle.
- Place stop loss below the most recent swing low.
- Close the trade when a red arrow appears or when MA Trend bars turn red.
Sell Entry Rules
- Confirm that the MA Trend indicator shows consecutive red bars, indicating a bearish trend.
- Wait for a red arrow from the Super Arrow indicator.
- Enter a sell trade at the close of the signal candle.
- Place stop loss above the most recent swing high.
- Close the trade when a blue arrow appears or when MA Trend bars turn blue.
Case Study 1: EURUSD M5 London Session Buy Trade
On EURUSD M5 during the London session, the MA Trend indicator printed consecutive blue bars, confirming a bullish trend.
Price was moving steadily upward with small pullbacks.
A blue arrow appeared from the Super Arrow indicator, signaling a buy opportunity.
A buy trade was opened at the close of the signal candle.
The stop loss was placed below the recent swing low to protect against sudden reversals.
The trade was closed when a red arrow appeared while MA Trend bars started losing momentum.
This showed that buyers were no longer in control and a pullback or reversal was beginning.
Case Study 2: GBPJPY M1 New York Session Sell Trade
On GBPJPY M1 during the New York session, the MA Trend indicator showed consecutive red bars, confirming a strong bearish trend.
Price continued forming lower highs and lower lows.
A red arrow appeared from the Super Arrow indicator, confirming a sell entry.
A sell trade was opened at the close of the signal candle.
The stop loss was placed above the recent swing high to allow space for minor retracements.
The trade was closed when a blue arrow appeared and MA Trend bars started shifting color.
This indicated that bearish pressure was weakening and the market was preparing for a reversal or consolidation.
Download Now
FAQ
What does the MA Trend indicator actually measure?
The indicator analyzes moving average calculations and converts them into colored bars that reflect the prevailing market direction.
This allows traders to quickly see whether bullish or bearish momentum is dominant.
Which trading sessions work best for this indicator?
Many traders prefer using the indicator during the London and New York sessions because these periods typically produce stronger price movement and clearer trend signals.
Can the MA Trend indicator be combined with other tools?
Yes. Traders often combine it with support and resistance analysis, oscillators, or price action methods to confirm potential entries.
Summary
The MA Trend Indicator provides a simple way to follow market direction by transforming moving average data into easy-to-read trend bars.
The color changes allow traders to quickly recognize whether bullish or bearish momentum is active.
Because the indicator follows the underlying trend, it can be useful for traders who prefer momentum-based strategies.
The adjustable settings also allow it to adapt to different trading styles and market conditions.


