About the No Lag MA Candle Indicator
The No Lag MA Candle Indicator for MT5 transforms standard price candles into color-coded trend candles.
Instead of plotting a traditional moving average line, it paints the candles directly on the main price area to reflect bullish or bearish momentum.
Blue candles signal bullish conditions, while brown candles indicate bearish pressure.
Because the calculation minimizes lag, the indicator reacts quickly to price shifts and highlights trend changes earlier than many standard moving averages.
Traders can adjust the look back period and applied price to match their preferred timeframe and volatility.
This flexibility makes the indicator practical for scalping, intraday trading, and short-term swing setups.
Free Download
NonLag ma trend.mq5 Indicator (MT5)
Key Features
- Displays colored candles directly on the main price area.
- Blue candles represent bullish momentum.
- Brown candles represent bearish momentum.
- Reduced lag compared to traditional moving averages.
- Customizable look back period and applied price input.
- Provides fast visual trend recognition.
Indicator Chart
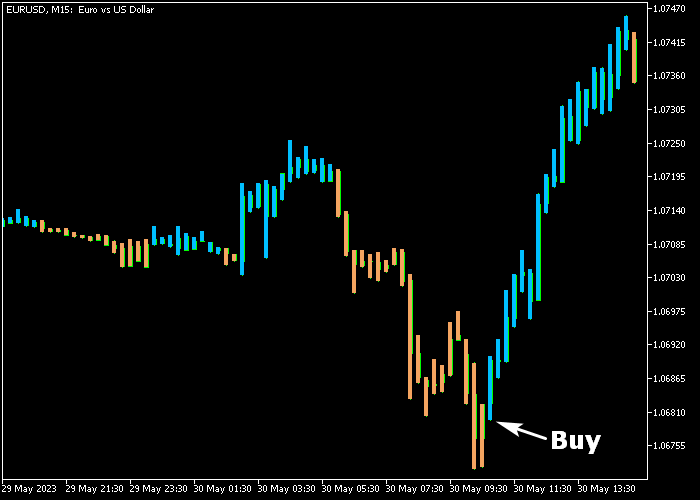
The No Lag MA Candle Indicator replaces standard candles with blue and brown trend candles.
A shift from brown to blue highlights bullish momentum, while a change from blue to brown signals bearish pressure.
The quick color transitions help traders react early to developing moves and potential reversals.
Guide to Trade with No Lag MA Candle Indicator
Buy Rules
- Wait for the first blue candle to appear after a sequence of brown candles.
- Enter a buy trade at the open of the next candle following the color change.
- Confirm that price begins forming higher highs and higher lows.
- Stay in the trade while blue candles continue to print consistently.
Sell Rules
- Watch for the first brown candle after a series of blue candles.
- Initiate a sell trade once the bearish candle closes.
- Ensure that price starts forming lower highs and lower lows.
- Hold the position as long as brown candles remain dominant.
Stop Loss
- Set the stop loss 3 pips below a recent support level for buy trades.
- Set the stop loss 3 pips above a recent resistance level for sell trades.
- Keep the risk aligned with your predefined percentage per trade.
Take Profit
- Close and reverse the position when the candle color flips in the opposite direction.
- Alternatively, secure profits at a fixed reward target based on your strategy.
- Trail the stop behind recent swing points if momentum accelerates.
- Exit fully when price action shows exhaustion against your position.
No Lag MA Candle Indicator and ATR Adaptive T3 Strategy for MT5
This strategy combines the No Lag MA Candle Indicator with the ATR Adaptive T3 Indicator to create a clean and responsive day trading system.
It focuses on aligning candle-based signals with a volatility-adaptive trend filter.
The No Lag MA Candle indicator simplifies price action by coloring candles based on direction.
Blue candles indicate bullish pressure while brown candles show bearish control.
The ATR Adaptive T3 acts as a smooth trend line that adapts to market volatility and changes color depending on direction, helping traders confirm trend strength and avoid false signals. :
This combination works because it blends immediate visual signals from candles with a more stable trend confirmation.
The strategy performs best on M5 and M15 timeframes and is designed for active day trading across major currency pairs.
Buy Entry Rules
- Wait for a blue candle to appear from the No Lag MA Candle indicator.
- Confirm that the ATR Adaptive T3 line is green, showing a bullish trend.
- Enter a buy trade at the close of the blue candle.
- Place the stop loss below the most recent swing low.
- Take profit when the candles turn brown or when the ATR Adaptive T3 line switches to magenta.
Sell Entry Rules
- Wait for a brown candle to appear from the No Lag MA Candle indicator.
- Confirm that the ATR Adaptive T3 line is magenta, showing a bearish trend.
- Enter a sell trade at the close of the brown candle.
- Place the stop loss above the most recent swing high.
- Take profit when the candles turn blue or when the ATR Adaptive T3 line switches to green.
Case Study 1: EURUSD M5 Buy Setup
During the London session on EURUSD M5, price showed a gradual upward movement after a short consolidation.
The No Lag MA Candle indicator printed a series of brown candles before shifting to a blue candle, signaling a change in momentum.
At the same time the ATR Adaptive T3 line turned green and started sloping upward, confirming that the market was entering a bullish phase.
A buy trade was opened at the close of the first strong blue candle.
Price continued moving upward with consistent blue candles, respecting the trend direction.
The trade remained active while both indicators stayed aligned.
The buy trade was closed when the first brown candle appeared alongside a flattening of the T3 line.
Case Study 2: GBPJPY M15 Sell Setup
On GBPJPY M15 during the New York session, price began to lose upward momentum and formed a topping structure.
The No Lag MA Candle indicator shifted from blue candles to a clear brown candle, signaling selling pressure.
Simultaneously, the ATR Adaptive T3 line turned magenta and angled downward, confirming bearish conditions.
A sell trade was entered at the close of the brown candle as both indicators aligned.
The market moved downward with steady bearish candles, maintaining structure without sharp reversals.
The trade stayed open while the candles remained brown and the T3 line held its downward slope.
The short position was closed when a blue candle appeared and the T3 line started to flatten.
Download Now
NonLag ma trend.mq5 Indicator (MT5)
FAQ
How is this different from a regular moving average?
Instead of plotting a line, this indicator colors the candles themselves. It reduces lag and delivers faster visual confirmation of trend direction.
Can it be used for scalping?
Yes, the fast reaction to price changes makes it suitable for lower timeframes. Many traders apply it on M5 and M15 for short momentum bursts.
What does the look back period control?
The look back period determines how sensitive the candles are to price movement. Lower values produce faster signals, while higher values create smoother trend shifts.
Should I combine it with other tools?
Combining it with support and resistance levels or a higher timeframe trend filter can improve trade selection and reduce false reversals.
Summary
The No Lag MA Candle Indicator offers a direct and responsive way to read trend direction through color-coded candles.
Its reduced lag helps traders react quickly to new momentum.
By following color transitions and applying logic trade management, traders can use this tool to capture short-term trends and manage reversals with confidence.