About the ATR Trailing Stop Indicator
The ATR Trailing Stop Indicator for MT5 is a volatility-based tool built around the Average True Range formula.
It calculates dynamic stop levels that adjust automatically as price moves.
This makes it useful not only for trade management but also for identifying potential trend reversals.
The indicator functions as a stop and reverse system. A green line signals bullish conditions, while a red line signals bearish pressure.
When the color changes, the directional bias shifts as well.
Because it adapts to market volatility, the trailing stop distance expands during high volatility and tightens during calmer periods.
Traders can adjust inputs such as period, coefficient, style, and colors to match their trading approach and timeframe.
Free Download
Mod_ATR_Trailing_Stop.mq5 Indicator (MT5)
Key Features
- Based entirely on the Average True Range formula.
- Acts as both a trailing stop and reversal signal tool.
- The green line indicates bullish direction.
- The red line indicates bearish direction.
- Automatically adjusts to market volatility.
- Customizable period and coefficient inputs.
Indicator Chart
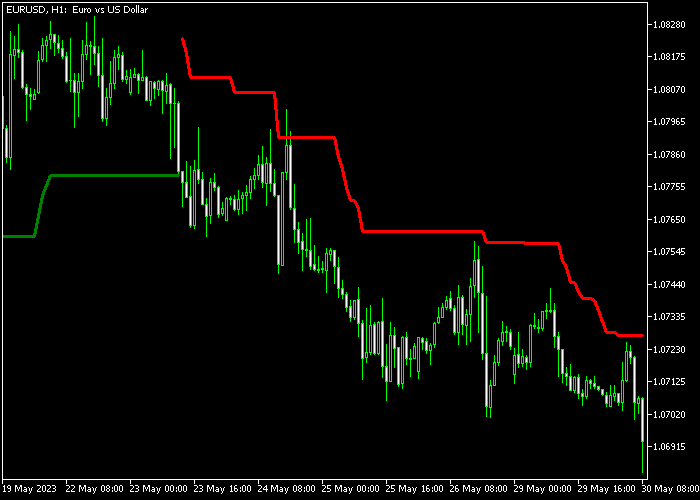
The ATR Trailing Stop Indicator plots a single colored line directly on the main price area.
When the line turns green and shifts below the candle, it reflects bullish momentum. When it turns red and moves above the candle, it signals bearish pressure.
The color transition marks potential reversal points and trailing stop adjustments.
Guide to Trade with ATR Trailing Stop Indicator
Buy Rules
- A buy setup forms when the ATR Trailing Stop line switches to green.
- Enter a buy trade once price closes above the green trailing line.
- Remain in the trade while the line stays green and follows price upward.
Sell Rules
- A sell setup appears when the ATR Trailing Stop line turns red.
- Open a sell trade after price closes below the red trailing line.
- Keep the position active as long as the line remains red.
Stop Loss
- Use the green trailing line as the stop reference for buy trades.
- Use the red trailing line as the stop reference for sell trades.
- Allow the stop to trail automatically as the line moves.
- Do not override the trailing logic unless volatility spikes sharply.
Take Profit
- Close the buy trade immediately when the line flips from green to red.
- Close the sell trade immediately when the line flips from red to green.
- Optionally scale out partial profits during extended trends.
- Fully exit once the reversal signal confirms.
ATR Trailing Stop Indicator and Auto Trend Lines Breakout Strategy for MT5
This breakout strategy combines the Auto Trend Lines Indicator with the ATR Trailing Stop Indicator to create a clear and disciplined trading approach.
It focuses on trading strong breakouts while managing risk dynamically using volatility-based trailing stops.
The Auto Trend Lines indicator automatically draws support and resistance levels based on price action, making it easier to spot breakout zones without manual analysis.
When price breaks these levels with a candle close, it often signals the start of a new move.
The ATR Trailing Stop indicator complements this by adjusting stop loss levels based on market volatility.
This allows the stop to follow price as it moves in your favor while staying wide enough to avoid being hit by normal fluctuations.
This strategy works best on M5 and M15 timeframes and is designed for traders who want to capture momentum after clean breakout moves.
Buy Entry Rules
- Wait for a candle to close above the blue resistance trend line from the Auto Trend Lines indicator.
- This breakout confirms a bullish signal.
- Enter a buy trade at the close of the breakout candle.
- Place the initial stop loss just below the breakout structure or recent swing low.
- Trail the stop loss upward using the ATR Trailing Stop green line, keeping it just below the line as price moves higher.
- Take profit when price closes back below the trailing stop line or when momentum weakens.
Sell Entry Rules
- Wait for a candle to close below the red support trend line from the Auto Trend Lines indicator.
- This breakout confirms a bearish signal.
- Enter a sell trade at the close of the breakout candle.
- Place the initial stop loss just above the breakout structure or recent swing high.
- Trail the stop loss downward using the ATR Trailing Stop red line, keeping it just above the line as price moves lower.
- Take profit when price closes back above the trailing stop line or when downward momentum fades.
Case Study 1: EURUSD M5 Buy Breakout
During the London session on EURUSD M5, price was consolidating below a clearly defined resistance line drawn by the Auto Trend Lines indicator.
Several attempts to break the level failed before a strong bullish candle finally closed above the blue resistance line.
This confirmed a breakout. A buy trade was opened at the candle close.
The ATR Trailing Stop printed its green line below price, providing a dynamic support level.
As price moved higher, the stop loss was continuously trailed just below the green line, allowing the trade to follow the breakout momentum.
The short position remained open while price stayed above the trailing stop.
The trade was closed when price retraced and closed below the green line, signaling that the upward move had weakened.
Case Study 2: GBPUSD M15 Sell Breakout
On GBPUSD M15 during the New York session, price formed a support level identified by the Auto Trend Lines indicator.
After a period of consolidation, a strong bearish candle closed below the red support line, confirming a breakout to the downside.
A sell trade was entered at the close of the breakout candle.
The ATR Trailing Stop displayed a red line above price, acting as a dynamic resistance.
As price moved downward, the stop loss was trailed just above this red line, following the bearish movement.
The trade continued while price respected the trailing stop.
The short trade was closed once price moved back above the red line, indicating a slowdown in the bearish momentum.
Download Now
Mod_ATR_Trailing_Stop.mq5 Indicator (MT5)
FAQ
What does the coefficient setting control?
The coefficient determines how far the trailing stop is placed from price.
A higher value increases the distance and reduces sensitivity, while a lower value creates tighter stops.
Can this indicator be used on lower timeframes?
Yes, it works on all timeframes supported by MT5.
On lower timeframes it reacts faster, while higher timeframes provide more stable trend signals.
Why is it called a stop and reverse system?
Because when the line changes color, it signals both an exit from the current position and a potential entry in the opposite direction.
Summary
The ATR Trailing Stop Indicator combines volatility measurement with practical trade management.
It defines dynamic stop levels and highlights trend reversals through simple color changes.
By following the trailing line and respecting color shifts, traders can manage risk systematically and stay aligned with prevailing momentum across different markets and timeframes.