About the Order Block Indicator
The Order Block Indicator for MT5 is a widely used trading tool that identifies buy and sell signals using order blocks.
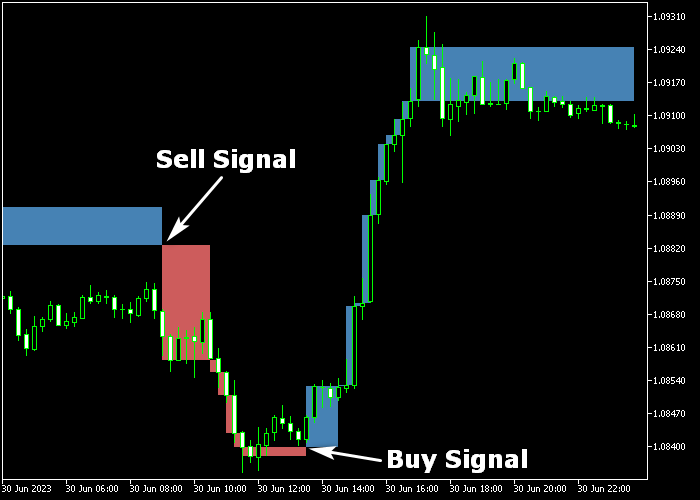
It is displayed in a separate chart window as a series of blue and red blocks to reflect market sentiment.
Blue order blocks indicate bullish conditions, while red order blocks signal bearish momentum.
The indicator is compatible with any trading style and timeframe, making it versatile for scalping, intraday, or swing trading.
Importantly, the blocks do not repaint, ensuring reliable signal confirmation.
Customizable inputs include the number of reversal lines, minimum box size, and the colors for up and down blocks.
Free Download
linebreakonchart.mq5 Indicator (MT5)
Key Features
- Blue and red order blocks for clear bullish and bearish signals.
- Blocks do not repaint, providing reliable signals.
- Customizable number of reversal lines and box size.
- Adjustable up and down block colors.
Indicator Chart
The Order Block Indicator appears in the main price chart window as colored blocks.
Blue blocks represent potential buying opportunities, and red blocks represent potential selling opportunities.

Guide to Trade with Order Block Indicator
Buy Rules
- Wait for a blue order block to appear on the chart.
- Open a buy trade at the candle close.
- Enter trades in the direction of the dominant buy trend.
Sell Rules
- Wait for a red order block to appear on the chart.
- Open a sell trade at the candle close.
- Enter trades in the direction of the prevailing sell trend.
Stop Loss
- For buy trades, place the stop loss just below the blue order block.
- For sell trades, place the stop loss just above the red order block.
Take Profit
- Close trades when the opposite colored order block appears (blue → red, red → blue).
- Alternatively, set a fixed pip profit target based on your strategy.
- Another option is to close trades at the next significant support or resistance level.
Order Block Forex Strategy for MT5
This Forex strategy combines key support and resistance identification with trend direction to generate structured entry and exit signals.
It uses the Order Block Indicator together with the Super Trend Hull Forex Indicator to catch directional moves while avoiding low probability setups.
The Order Block Indicator highlights potential supply and demand zones.
A blue block signals potential bullish pressure, while a red block suggests bearish pressure.
These areas often act as turning points in the market and provide high‑value entry zones.
The Super Trend Hull Forex Indicator helps define the prevailing trend.
A green line indicates an uptrend, while a violet line reflects a downtrend.
This gives context to the blocks and filters trades so entries are taken in the direction of the trend rather than against it.
This strategy works well on M15 and H1 timeframes.
Buy Entry Rules
- Wait for a blue order block to form, indicating a bullish zone.
- Confirm that the Super Trend Hull line is green, signaling a buy trend.
- Enter a buy trade when price revisits the blue block and shows a bullish reaction candle.
- Place the stop loss slightly below the order block zone.
- Close the trade when the Super Trend Hull line turns violet or when price moves into a nearby resistance zone.
- You can also aim for a 1:2 risk‑to‑reward exit.
Sell Entry Rules
- Wait for a red order block to appear, indicating a bearish zone.
- Confirm that the Super Trend Hull line is violet, signaling a sell trend.
- Enter a sell trade when price revisits the red block and the reaction candle shows bearish intent.
- Place the stop loss slightly above the order block zone.
- Exit the trade when the Super Trend Hull line turns green or when price reaches a nearby support level.
- Alternatively, use a fixed pip target such as 30 to 40 pips.
Case Study 1: USDCHF H1 Rejection Entry
On the USDCHF H1 chart, a blue order block formed after a pullback in a wider uptrend.
The Super Trend Hull line was green at that time, confirming bullish conditions.
Price returned to the blue block and formed a strong bullish engulfing candle around that zone.
A buy position was opened on the close of that candle with the stop placed below the order block.
Price rallied in the direction of the trend and approached the next resistance region.
When the Super Trend Hull line shifted to violet during a minor retracement, the trade was exited for +42 pips.
Case Study 2: EURAUD M15 Turnaround
On EURAUD M15 during an active session, price formed a red order block after a sharp downturn.
The Super Trend Hull line was violet, signaling bearish control.
Price revisited the red block and showed a bearish pin bar at that zone.
A sell trade was initiated at the close of that candle, with the stop loss placed just above the order block.
Price moved lower in a strong downward wave.
As the market approached a significant support region, the Super Trend Hull line began turning green and the downward momentum eased.
At that point the position was closed for a small loss.
Download Now
linebreakonchart.mq5 Indicator (MT5)
FAQ
What are order blocks in this indicator?
Order blocks are clusters of buying or selling activity.
Blue blocks represent bullish demand zones, and red blocks represent bearish supply zones.
Do the order blocks repaint?
No. Once an order block forms, it remains fixed on the chart.
Which timeframes are best for trading with this indicator?
The indicator works across all timeframes.
Lower timeframes offer faster entries for scalping, while higher timeframes provide more stable setups for swing trading.
Can this indicator be used alone?
Yes. It provides clear buy and sell signals on its own.
Traders may combine it with support/resistance or trend tools for additional confirmation.
Summary
The Order Block Indicator identifies bullish and bearish zones using colored blocks, simplifying the process of spotting trade entries and exits.
With customizable settings, non-repainting signals, and compatibility across all timeframes, it is a reliable tool for both new and experienced traders seeking systematic trade setups.


