About the Simple Signal Levels Indicator
The Simple Signal Levels indicator is an automated breakout tool for MetaTrader 5 that identifies price boundaries.
It specializes in plotting the best possible buy and sell breakout lines by analyzing historical price peaks and troughs.
The indicator uses a sophisticated zigzag-based logic to determine where the market is likely to find friction or accelerate.
The tool identifies a blue resistance line and a red support line, often referred to as Vibrix lines.
When the price breaks and closes beyond these levels, it signals that the current momentum is strong enough to establish a new trend.
It is particularly effective for catching explosive moves that occur during the transition from consolidation to a trending market.
Free Download
simplezzlevels.mq5 Indicator (MT5)
Key Features
- Automates the plotting of support and resistance levels using objective price data.
- Uses a color-coded system with blue for resistance and red for support.
- Provides definitive breakout signals based on candle closing prices.
- Eliminates the subjectivity involved in manual trendline and level drawing.
Indicator Chart
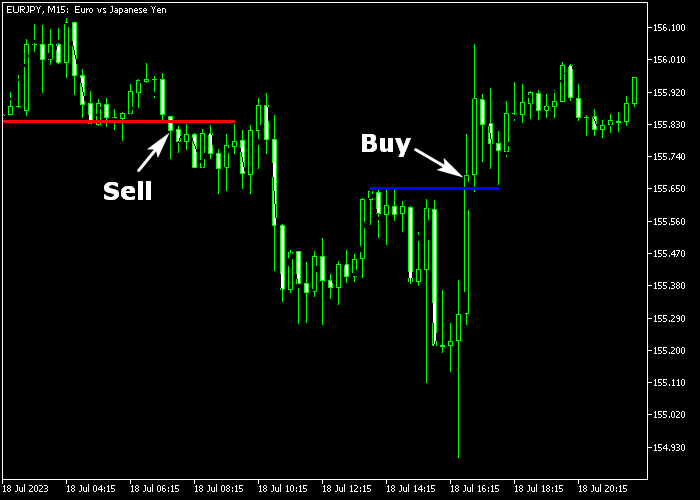
The Simple Signal Levels indicator chart displays horizontal or slightly angled lines that act as a ceiling and floor for the price action.
The blue resistance line marks the threshold for bullish breakouts, while the red support line marks the trigger for bearish moves.
Trading signals are confirmed only when a candle successfully closes outside of this defined range.

Guide to Trade with the Simple Signal Levels indicator
Buy Rules
- Monitor the price action as it approaches the blue resistance line.
- Wait for a candle to close completely above the blue colored Vibrix line.
- Initiate a buy transaction at the opening of the very next candle.
Sell Rules
- Observe the price movement as it nears the red support level.
- A sell signal is generated when a candle closes below the red colored line.
- Open a sell position immediately after the breakout candle is finalized.
Stop Loss
- For buy trades, place your stop loss below the most recent swing low zone.
- For sell trades, position your stop loss above the most recent swing high area.
- Adjust the placement if the breakout candle is unusually large.
Take Profits
- Exit the trade when a risk/reward ratio of at least 1.5 is achieved.
- Consider aiming for a 2.0 ratio or higher during strong trending markets.
- Secure partial profits if the price reaches a major psychological level.
Simple Signal Levels Indicator Breakout Strategy for MT5
This breakout strategy combines the Simple Signal Levels indicator for MT5 with the Super Channels Forex indicator for MT5 to capture strong price expansions when the market breaks key levels.
The approach is based on trading clear breakouts that align with the dominant trend.
The Simple Signal Levels indicator defines important breakout zones, while the Super Channels indicator confirms whether the market direction supports the move.
The Simple Signal Levels indicator marks resistance and support levels where price is likely to react.
A breakout above the blue resistance line signals bullish strength, while a move below the red support line signals bearish pressure.
The Super Channels indicator adds confirmation by showing trend direction through channel color.
A green channel reflects a buy trend, while a red channel reflects a sell trend.
This strategy performs strongly on M15 and H1 timeframes and suits traders who prefer structured breakout trading with clear confirmation.
It helps traders avoid false signals and concentrate on moves that have strong follow-through potential.
Buy Entry Rules
- Wait for the candle to close above the blue resistance line.
- Confirm that the Super Channels indicator is green.
- Enter a buy trade at the close of the breakout candle.
- Place the stop loss below the broken resistance level.
- Take profit when the channel turns red or when price shows signs of rejection at the next resistance level.
Sell Entry Rules
- Wait for the candle to close below the red support line.
- Confirm that the Super Channels indicator is red.
- Enter a sell trade at the close of the breakout candle.
- Place the stop loss above the broken support level.
- Take profit when the channel turns green or when price begins to stall near the next support zone.
Case Study 1: Buy Breakout on USD/CHF
On the M15 timeframe on USD/CHF, price tested a blue resistance level multiple times before finally breaking above it with a strong bullish candle.
This breakout indicated a shift in momentum.
The Super Channels indicator was already green, confirming the bullish trend.
A buy trade was entered immediately after the breakout candle closed.
Price continued to rise steadily, supported by the trend.
The position was held while the channel remained green.
Once price started to hesitate near the next resistance area and the move slowed down, the trade was closed for a little profit.
Case Study 2: Sell Breakout on AUD/JPY
On the H1 timeframe on AUD/JPY, price broke below a red support line with strong bearish momentum. This confirmed a downside breakout.
The Super Channels indicator was red, aligning with the bearish move.
A sell trade was opened after the candle closed below support. Price moved lower with consistent pressure from sellers.
The channel stayed red throughout the move, confirming trend continuation.
The trade was closed as price approached the next support zone and momentum began to weaken.
The trade was closed with a solid gain.
Download Now
simplezzlevels.mq5 Indicator (MT5)
FAQ
Is this indicator better for range trading or breakouts?
This indicator is specifically designed for breakout trading.
While the lines act as support and resistance, the primary signal is the “break and close” beyond the lines.
It is meant to capture the momentum that follows a successful breach of a price ceiling or floor.
How do I avoid false breakouts?
False breakouts are common during low-liquidity sessions.
To increase accuracy, only trade breakouts that occur during the London or New York sessions.
Additionally, waiting for a strong, “decisive” candle close that is significantly beyond the line can help filter out noise.
Summary
The Simple Signal Levels indicator for Metatrader 5 specializes in plotting the best possible buy and sell price breakout lines on the price chart.
The simplicity of buying on a blue line breach and selling on a red line breach makes it an excellent choice for those who prefer objective entry rules.
While the system is straightforward, its power lies in its ability to adapt to various market conditions through its customizable inputs.
Familiarizing yourself with how different price types react to these levels on a demo account will significantly improve your execution in live markets.


