
About the Trend Line By Angle Indicator
The Trend Line By Angle indicator for MT5 is a trend analysis tool that automatically plots angled support and resistance lines directly on the price area.
It helps traders detect potential breakout opportunities and identify possible entry and exit points based on price interaction with these trend lines.
The indicator calculates trend lines using predefined angle values and a selected number of previous bars.
It then plots two important levels on the price area: a purple resistance trend line and a blue support trend line.
These levels act as dynamic barriers that price must break to signal a potential trading opportunity.
When the candle closes above the upper resistance trend line, it suggests bullish strength and a possible buy setup.
When the candle closes below the support trend line, it indicates bearish pressure and a possible sell opportunity.
Free Download
TrendlinebyAngle.mq5 Indicator (MT5)
Key Features
- Automatically draws angled support and resistance trend lines.
- The upper purple line identifies potential breakout resistance levels.
- Lower blue line marks dynamic support areas.
- Helps identify breakout entries and exit opportunities.
- Customizable number of previous bars for calculations.
- Adjustable angle values for both upward and downward lines.
- Allows modification of line style and color.
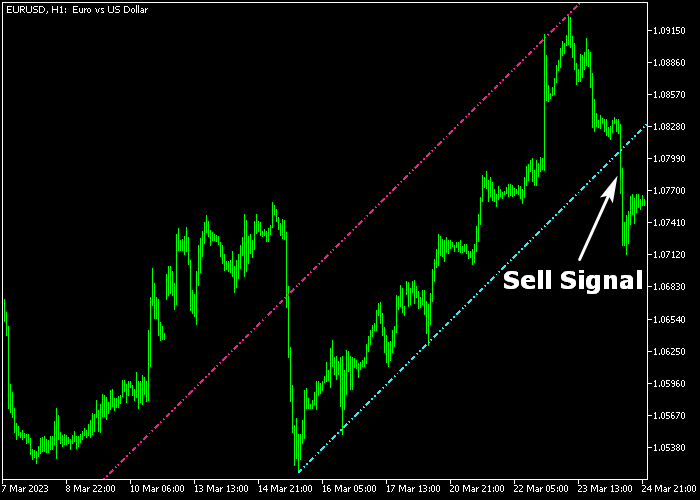
Indicator Chart
The Trend Line By Angle indicator appears directly on the main price area, plotting a purple resistance trend line and a blue support trend line.
Price movements interact with these angled lines, and breakout candles above or below them indicate potential trading opportunities.
Guide to Trade with Trend Line By Angle Indicator
Buy Rules
- Watch for the price approaching the upper purple resistance trend line.
- Wait for a strong candle to break and close above the line.
- Confirm that the breakout occurs with bullish momentum.
- Open a buy position after the breakout candle closes above the trend line.
Sell Rules
- Monitor price as it moves near the lower blue support trend line.
- Wait for a candle to break and close below the support line.
- Confirm that bearish pressure continues after the breakout.
- Enter a sell trade once the breakout candle closes below the line.
Stop Loss
- Place the stop loss slightly below the breakout candle for buy trades.
- For sell trades, place the stop loss just above the breakout candle.
- Another option is placing the stop beyond the most recent swing level.
Take Profit
- Set a take profit level targeting at least a 1.5 reward to risk ratio.
- Close the trade if price returns and closes back inside the trend line.
- Exit the position once the breakout momentum starts to fade.
MT5 Trend Line by Angle Indicator Breakout Strategy
This strategy combines the Trend Line by Angle Indicator with the Median Moving Average Indicator to create a clear breakout trading approach.
The Trend Line by Angle indicator plots dynamic resistance and support levels using angled lines.
A close above the upper purple resistance line signals a bullish breakout, while a close below the lower blue support line signals a bearish breakout.
The Median Moving Average confirms direction by showing whether price is trading above or below the average.
This keeps trades aligned with the breakout direction and avoids false entries.
This method works well on M5 and M15 charts for active pairs where breakouts form with clean structure.
It suits traders who focus on timing entries after confirmation rather than anticipating moves.
Buy Entry Rules
- Wait for price to close above the upper purple resistance trend line from the Trend Line by Angle indicator.
- Confirm that price is above the Median Moving Average.
- Enter a buy trade after the breakout candle closes.
- Place the stop loss below the breakout level or below the Median Moving Average.
- Close the buy trade when price closes below the Median Moving Average or when price falls back below the upper trend line.
Sell Entry Rules
- Wait for price to close below the lower blue support trend line from the Trend Line by Angle indicator.
- Confirm that price is below the Median Moving Average.
- Enter a sell trade after the breakout candle closes.
- Place the stop loss above the breakout level or above the Median Moving Average.
- Close the sell trade when price closes above the Median Moving Average or when price moves back above the lower trend line.
Case Study 1: EURUSD M5 Breakout Trade
On EURUSD M5, price approached the upper purple resistance line and then closed above it, confirming a breakout.
The candle also closed above the Median Moving Average, supporting bullish direction.
A buy trade was entered after the breakout candle closed. The stop loss was placed below the breakout level.
About 40 minutes later, price closed back below the Median Moving Average.
The buy trade was closed at that moment based on the Median Moving Average indicating a shift in direction.
Case Study 2: GBPUSD M15 Breakout Trade
On GBPUSD M15, price moved toward the lower blue support line and then closed below it, confirming a bearish breakout.
The candle remained below the Median Moving Average, confirming sell conditions.
A sell trade was entered after the signal candle closed. The stop loss was placed above the breakout level.
8 candles later, price closed back above the lower blue support line.
The sell trade was closed at that point based on the Trend Line by Angle indicator showing a failed breakout.
Download Now
TrendlinebyAngle.mq5 Indicator (MT5)
FAQ
What makes the Trend Line By Angle indicator different from regular trend lines?
This indicator automatically plots angled trend lines based on predefined calculations.
It removes the need to draw trend lines manually and keeps the levels updated as price moves.
Which settings can be customized?
Traders can adjust the number of previous bars used for calculations, the downward and upward line angles, as well as the visual style and color of the trend lines.
Can the indicator be used on all markets?
Yes. The indicator works with any trading instrument available on the MT5 platform, including forex pairs, indices, and commodities.
Summary
The Trend Line By Angle indicator provides an automated way to monitor trend line breakouts using angled support and resistance levels.
Highlighting important breakout zones directly on the price area helps currency traders identify potential entry and exit opportunities.
Its customizable settings allow traders to adapt the angle sensitivity and historical bar calculations to match different trading styles.
For traders who prefer breakout strategies, the tool offers a practical approach to identifying when prices move beyond key trend line levels.


