About the Wyatts Pivots Indicator
The Wyatts Pivots for MT5 is a technical indicator designed to plot pivot levels together with important support and resistance zones directly on the price area.
These levels help traders understand where price may react, reverse, or continue its movement.
The indicator calculates a central pivot level and then projects surrounding zones that act as potential barriers for price.
When the market trades above the pivot, it generally signals bullish conditions.
When price moves below the pivot level, it suggests bearish pressure in the market.
Traders often use these levels to identify possible entry points, manage stop loss placement, and plan realistic profit targets.
The zones also provide a quick overview of where price may slow down or change direction.
Several settings can also be customized, including the number of periods used for calculations, the time period, and the visual display of pivot levels.
Free Download
WyattsPivots.mq5 Indicator (MT5)
Key Features
- Automatic pivot point calculation based on recent price data.
- Support and resistance zones plotted directly on the price area.
- Central pivot level used to determine market bias.
- Customizable display options including colors and borders.
- Optional plotting of future pivot levels for forward analysis.
Indicator Chart
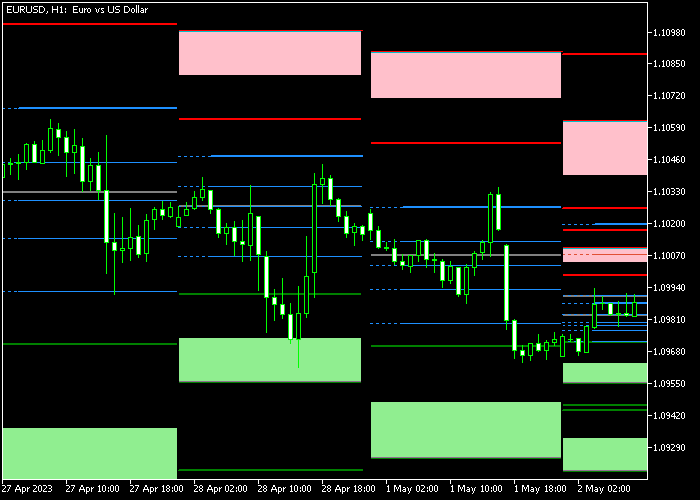
The Wyatts Pivots indicator appears on the main price area and displays a central pivot line together with surrounding support and resistance zones.
Green zones represent potential support levels while light-red zones mark resistance areas.
Traders often watch how price behaves around these levels to identify potential trade opportunities.

Guide to Trade with Wyatts Pivots Indicator
Buy Rules
- Wait for price to cross above the Wyatts pivot level.
- This movement suggests a shift toward bullish market conditions.
- Open a buy trade after the candle closes above the pivot.
- Monitor price as it moves toward the next resistance zones.
Sell Rules
- Wait for price to cross below the Wyatts pivot level.
- This indicates increasing bearish pressure.
- Open a sell trade once the candle closes below the pivot.
- Observe price movement toward the nearby support zones.
Stop Loss
- Place the stop loss slightly below the first green support zone for buy trades.
- Place the stop loss slightly above the first light-red resistance zone for sell trades.
- Ensure the trade risk fits your overall trading plan.
Take Profit
- Close buy trades near one of the light-red resistance zones.
- Close sell trades near one of the green support zones.
- Partial profit taking can be used if price approaches key levels.
- Another option is to exit the trade if price returns across the pivot level.
MT5 Wyatts Pivots Indicator Forex Strategy
This strategy combines the Wyatts Pivots Indicator with the Indicator Arrows Alert to create a simple and effective trading approach across M5, M15, and H1 timeframes.
The Wyatts Pivots indicator highlights key pivot levels along with support and resistance zones directly on the price.
These levels help traders identify whether the market is bullish or bearish based on price position relative to the pivot.
When price trades above the pivot level, it suggests bullish conditions, while trading below it indicates bearish pressure.
The Indicator Arrows Alert provides clear entry signals by plotting arrows on the chart.
A green arrow signals a potential bullish move, while a red arrow indicates a possible bearish shift.
This combination works well because the pivot defines market bias while the arrows refine entry timing.
It is suitable for intraday traders who want a structured and easy-to-follow system.
Buy Entry Rules
- Confirm that price closes above the Wyatts pivot level, indicating a bullish market.
- Wait for a green arrow from the Indicator Arrows Alert.
- Enter a buy trade at the close of the signal candle.
- Place a stop loss below the nearest support zone or below the pivot level.
- Close the trade when price falls back below the pivot level or when a red arrow appears.
Sell Entry Rules
- Confirm that price closes below the Wyatts pivot level, indicating a bearish market.
- Wait for a red arrow from the Indicator Arrows Alert.
- Enter a sell trade at the close of the signal candle.
- Place a stop loss above the nearest resistance zone or above the pivot level.
- Close the trade when price moves back above the pivot level or when a green arrow appears.
Case Study 1: EURUSD M15 London Session Buy Trade
On EURUSD M15 during the London session, price closed above the pivot level, confirming bullish conditions.
Shortly after, a green arrow appeared, signaling a buy opportunity. A buy trade was opened at the close of the signal candle.
The stop loss was placed below the nearest support zone just under the pivot level.
The trade was closed when price dropped back below the pivot level, showing that bullish strength had weakened and the market was shifting direction.
Case Study 2: USDCHF M5 New York Session Sell Trade
On USDCHF M5 during the New York session, price moved below the pivot level and remained there, confirming bearish pressure.
A red arrow appeared during a minor pullback, signaling a sell entry. A sell trade was opened at the close of the signal candle.
The stop loss was placed above a nearby resistance zone formed earlier in the session.
The trade was closed when a green arrow appeared and price moved back above the pivot level, indicating that selling momentum had faded and a reversal was starting.
Download Now
WyattsPivots.mq5 Indicator (MT5)
FAQ
What makes the Wyatts Pivots indicator useful for traders?
The indicator automatically draws pivot levels along with support and resistance zones.
This allows traders to quickly identify areas where price may react.
How is the market bias determined?
The market bias is based on the position of the candle relative to the pivot level.
Price trading above the pivot suggests bullish conditions, while price below the pivot suggests bearish sentiment.
Can the indicator be customized?
Yes. Traders can adjust parameters such as count periods, the calculation timeframe, pivot display options, and visual settings like colors and borders.
Is this indicator limited to Forex trading?
No. The Wyatts Pivots indicator can be applied to any instrument available on the MetaTrader 5 platform, including commodities, indices, and cryptocurrencies.
Summary
The Wyatts Pivots indicator provides traders with a practical way to monitor important price levels based on pivot calculations.
By plotting both support and resistance zones, it becomes easier to evaluate potential trading opportunities.
The central pivot line also offers a quick reference for identifying the general market direction.
Traders can use this information to align their trades with the prevailing price movement.
When combined with additional technical analysis, Wyatts Pivots can assist traders in planning entries, exits, and trade targets more effectively.


