About the Gap Finder Indicator
The Gap Finder Indicator for MT5 is designed to detect price gaps that occur between the close of one candle and the open of the next.
These gaps often appear when strong buying or selling pressure enters the market, especially during volatile sessions or after major news events.
The indicator automatically scans the price action and highlights these gaps directly on the price area.
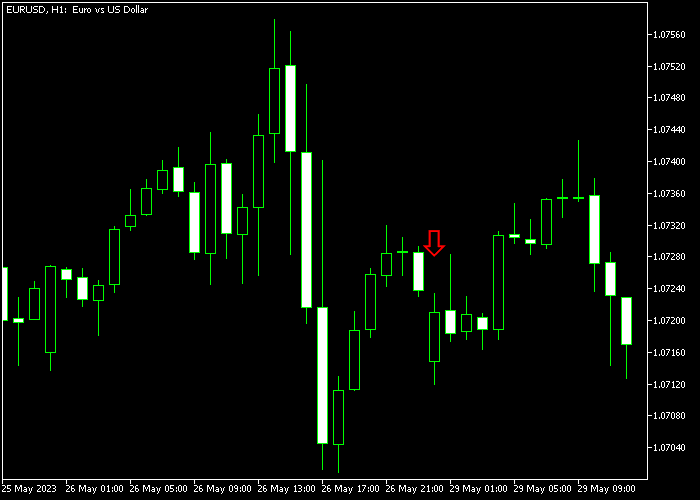
When a bullish gap appears, the indicator prints a green arrow. When a bearish gap forms, a red arrow is displayed.
These arrows help traders quickly identify moments where price momentum may continue in the direction of the gap.
Many traders combine it with trend indicators or support and resistance analysis to confirm the best possible entry after a gap has formed.
Free Download
Key Features
- Automatically detects price gaps between consecutive candles.
- Displays green arrows for bullish gaps and red arrows for bearish gaps.
- Helps traders identify momentum shifts in the market.
- Useful for identifying continuation opportunities in trending markets.
- Can be combined with other technical indicators for confirmation.
Indicator Chart
The Gap Finder Indicator highlights bullish and bearish price gaps beneath the main price area using directional arrows.
The example shows green arrows marking upward gaps and red arrows marking downward gaps as price moves with the trend.

Guide to Trade with Gap Finder Indicator
Buy Rules
- Confirm that the market is moving in a visible uptrend.
- Wait for a green Gap Finder arrow to appear on the price area.
- The arrow signals a bullish gap between the previous close and current open.
- Open a buy position after the bullish gap signal appears.
Sell Rules
- Confirm that the market is moving in a visible downtrend.
- Wait for a red Gap Finder arrow to appear on the price area.
- The arrow signals a bearish gap between the previous close and current open.
- Open a sell position after the bearish gap signal appears.
Stop Loss
- Place the stop loss below the most recent swing support for buy trades.
- For sell trades, place the stop loss above the most recent swing resistance.
- Adjust the stop loss as new support or resistance levels develop.
Take Profit
- Close the buy trade if momentum weakens and price drops below recent support.
- Close the sell trade if price climbs back above recent resistance.
- Many traders also secure profits gradually as the trend continues.
Gap Finder and Jurik Moving Average Gap Trading Strategy for MT5
This strategy combines the Gap Finder Indicator with the Jurik Moving Average Indicator to create a focused gap trading approach.
It is designed to capture short term opportunities that arise when price gaps and then continues or stabilizes in the direction of the underlying trend.
The Gap Finder indicator highlights price gaps and provides clear arrow signals for potential entries.
Gaps often occur due to sudden market imbalances or news events, causing price to jump without trading in between levels.
The Jurik Moving Average acts as a trend filter.
It is known for being smoother and more responsive than traditional moving averages, helping traders identify direction while filtering noise.
This method works best on M5 and M15 charts and can be applied across different forex pairs during active sessions.
Buy Entry Rules
- Wait for a green arrow from the Gap Finder indicator, signaling a bullish gap opportunity.
- Confirm that price is trading above the Jurik Moving Average.
- Enter a buy trade at the close of the signal candle.
- Place the stop loss below the gap zone or below the Jurik Moving Average for a tighter setup.
- Take profit near the next resistance level or when price closes back below the moving average.
Sell Entry Rules
- Wait for a red arrow from the Gap Finder indicator, signaling a bearish gap opportunity.
- Confirm that price is trading below the Jurik Moving Average.
- Enter a sell trade at the close of the signal candle.
- Place the stop loss above the gap area or just above the moving average if the setup is tight.
- Take profit near the next support level or when price closes back above the moving average.
Case Study 1: USDJPY M5 Gap Continuation
During the Tokyo session on USDJPY M5, price opened with a small upward gap after a period of consolidation.
The Gap Finder indicator printed a green arrow, highlighting a potential continuation move.
At the same time, price remained clearly above the Jurik Moving Average, which was sloping upward and acting as dynamic support.
A buy trade was taken at the close of the signal candle.
Instead of placing the stop too close, it was positioned just below the gap zone where the imbalance started.
Price continued moving upward in line with the trend, maintaining distance from the moving average until momentum began to slow.
Case Study 2: AUDUSD M15 Gap Rejection
On AUDUSD M15 during the London session, price formed a downward gap after a brief upward correction.
The Gap Finder indicator displayed a red arrow, signaling a potential bearish move.
Price was already trading below the Jurik Moving Average, which had started to slope downward.
A sell trade was entered at the close of the signal candle.
In this scenario, the stop loss was placed just above the moving average rather than the gap itself, using it as a dynamic resistance level.
Price moved lower with steady pressure, respecting the bearish structure and remaining below the average.
Download Now
FAQ
What does the Gap Finder indicator detect?
The indicator scans the market for gaps between the previous candle’s close and the current candle’s open.
These gaps can reveal sudden changes in buying or selling pressure.
Should the Gap Finder indicator be used alone?
Many traders combine the indicator with trend indicators, moving averages, or support and resistance levels.
This helps confirm whether the gap aligns with the broader market direction.
Summary
The Gap Finder Indicator is a practical tool for identifying sudden price gaps that can signal strong market momentum.
By highlighting bullish and bearish gaps with simple arrow signals, the indicator allows traders to react quickly when unusual price movement occurs.
These signals become more useful when they appear during established trends.
Traders can use them as confirmation for continuation trades or as a warning that volatility has entered the market.


