About the Larry Williams Swing High/Low indicator
The Larry Williams Swing High/Low indicator for MT5 is a technical tool designed to identify significant structural pivot points within the market.
It automatically detects peaks and troughs by comparing price action across consecutive candles, marking these levels with blue circles.
These points represent psychological support and resistance zones where institutional order flow often shifts.
This tool helps traders map out the market trend and identify high-probability breakout opportunities.
It is an essential utility for those who rely on price action and market geometry to make informed trading decisions.
Free Download
larrywilliams_minmax.mq5 Indicator (MT5)
Key Features
- Automatically identifies and marks significant swing high and low points on the chart.
- Uses blue circles to provide a clean visual representation of market pivot levels.
- Helps define objective support and resistance zones based on historical price peaks.
- Includes a toggle to ignore inside bars for more accurate structural analysis.
- Facilitates the identification of trend shifts through the break of previous swing levels.
Indicator Chart
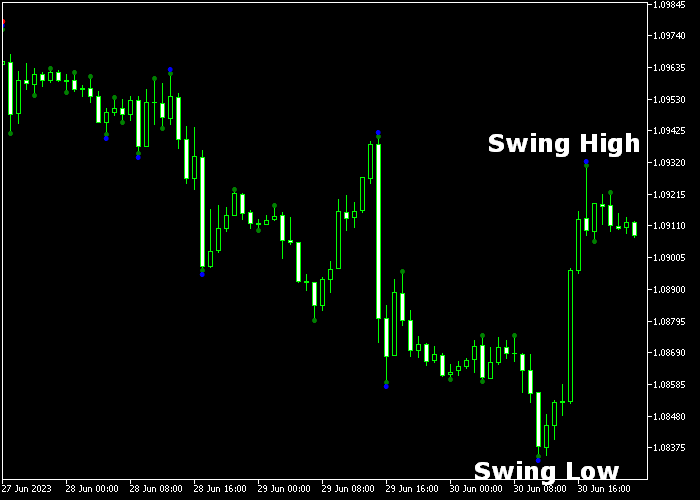
The chart shows the Larry Williams Swing High/Low indicator displaying blue circles above price peaks and below price troughs.
You can see how these points create a roadmap of the current trend direction and highlight the levels where breakouts are likely to occur.
These markers serve as the foundation for identifying both entry triggers and defensive exit zones.

Guide to Trade with Larry Williams Swing High/Low indicator
Buy Rules
- Monitor the price action until a candle closes firmly above the previous blue swing high circle.
- Ensure the breakout occurs with strong momentum to confirm the continuation of a bullish trend.
- Verify that the market is making higher lows to support the validity of the upward move.
- Execute a buy market order once the breakout candle has successfully closed above the resistance.
Sell Rules
- Initiate a sell market order when a candle closes below the previous blue swing low circle.
- Check that the bearish breakout is supported by a shift in market sentiment and volume.
- Confirm that the price is carving out lower highs to validate the emerging downtrend.
- Open the short position only after the breakout is confirmed on the current trading timeframe.
Stop Loss
- Place a protective stop order behind the opposite blue swing circle for maximum security.
- Set the stop loss a few pips away from the trigger candle to protect against false breakouts.
- Utilize a dynamic stop that moves behind each new swing low formed during an uptrend.
- Position the stop loss at a level where the current market structure would be considered void.
Take Profit
- Exit the trade when the market reaches a pre-defined risk to reward ratio of 1.5 or better.
- Close the position manually if price action reaches a significant historical resistance or support zone.
- Consider scaling out of the trade as the price approaches the next major structural pivot.
Larry Williams Swing High Low Scalping Strategy for MT5
This scalping strategy combines breakout detection with precise signal confirmation using the Larry Williams Swing High Low Indicator and the Super Signals Indicator.
It is designed to help traders capture quick directional moves by waiting for clean breakout signals followed by confirmation from a secondary indicator.
The Larry Williams Swing High Low Indicator identifies key swing points in price action.
The Super Signals Indicator adds confirmation with buy and sell arrows.
A blue arrow signals bullish pressure and a potential buy entry, while a magenta arrow signals bearish pressure and a potential sell entry.
This strategy works well on M1 and M5 timeframes during active sessions when price has enough volatility to make quick runs.
Buy Entry Rules
- Wait for a candle to close above the previous blue swing high circle.
- Confirm that a blue arrow appears from the Super Signals Indicator after or at the same time as the breakout candle.
- Enter a buy trade at the close of the confirmation candle.
- Place the stop loss below the breakout candle’s low or just below the swing high level that was broken.
- Close the trade when a magenta arrow appears or when price begins forming consecutive opposite directional bars.
Sell Entry Rules
- Wait for a candle to close below the previous red swing low circle.
- Confirm that a magenta arrow appears from the Super Signals Indicator after or at the same time as the breakout candle.
- Enter a sell trade at the close of the confirmation candle.
- Place the stop loss above the breakout candle’s high or just above the broken swing low level.
- Close the trade when a blue arrow appears or when price begins forming multiple opposite bars.
Case Study 1: USDJPY M1 Breakout Scalping
On USDJPY M1 during a fast London session, price closed above a previous blue swing high circle.
Shortly afterward, a blue arrow appeared from the Super Signals Indicator, reinforcing the bullish pressure.
A buy trade was taken at the close of the confirmation candle with the stop placed below the breakout candle’s low.
Price quickly rallied in direction of the breakout with strong bullish candles driving the move.
A magenta arrow eventually appeared as price lost upward momentum.
That signal indicated it was time to exit and preserve the gains from the quick scalping run.
Case Study 2: GBPUSD M5 Downside Break
On GBPUSD M5 during the New York session, a candle closed below the previous red swing low circle, signaling a potential bearish breakout.
Around the same time, the Super Signals Indicator printed a magenta arrow.
A sell trade was initiated at the close of the confirmation candle with the stop above the breakout bar’s high.
Price continued lower in a clean decline with consecutive red bars.
A blue arrow later formed as momentum weakened and price began to chop.
That arrow served as the exit point and the short trade was exited for 31 pips profit.
Download Now
larrywilliams_minmax.mq5 Indicator (MT5)
FAQ
How does the “ignore inside bars” setting work?
This parameter allows the indicator to skip candles that are completely engulfed by the previous bar.
This ensures that swing points are only marked on significant price extensions, leading to more reliable support and resistance levels.
Can I use this for identifying trend reversals?
Yes, it is excellent for reversals.
A reversal is often confirmed when the price stops making new swing highs and instead breaks below a previous swing low, signaling a shift in market dominance.
Summary
The Larry Williams Swing High/Low indicator provides an objective method for identifying the structural pillars of price action, making it easier to spot trend continuations and reversals.
The simplicity of its breakout logic makes it a versatile addition to any professional trading strategy.
Overall, it is a stable and responsive tool that enhances market structure awareness.
Combining these signals with volume analysis can further increase the success rate of your breakout trades.


