
About the ATR Stop Loss Line Indicator
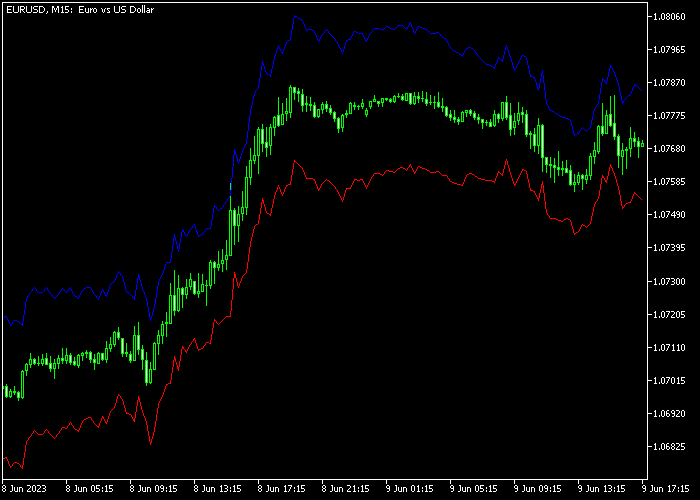
The ATR Stop Loss Line Indicator for MT5 is a practical tool that calculates suggested stop loss levels for both buy and sell positions.
Using the Average True Range (ATR) as its basis, it draws red and blue lines directly on the chart, giving traders a dynamic reference for risk management.
For buy trades, the red line marks a suggested stop placement below current price action.
For sell trades, the blue line indicates a stop level above the market.
These lines help traders define their risk consistently without guessing.
Inputs such as ATR period and target distance can be adjusted to match different strategies and volatility conditions.
Free Download
StopATR_auto.mq5 Indicator (MT5)
Key Features
- The red line indicates the suggested stop for buy trades.
- The blue line indicates the suggested stop for sell trades.
- Stops are calculated dynamically using Average True Range (ATR).
- Displayed directly on the price chart for clear reference.
- Customizable ATR period and target distance.
- Enhances risk management for any trading strategy.
Indicator Chart
The ATR Stop Loss Line Indicator shows red and blue stop lines on the main chart.
Traders can use these levels to place stops that adjust automatically with price volatility, improving trade management and protecting against sudden market swings.

Guide to Trade with ATR Stop Loss Line Indicator
Buy Rules
- Check the red ATR stop loss line below the current price.
- Use the line as a reference for risk on buy trades.
- Enter buy positions according to your trading strategy.
- Ensure your stop placement respects the ATR line to maintain proper risk control.
Sell Rules
- Check the blue ATR stop loss line above the current price.
- Use the line as a reference for risk on sell trades.
- Enter sell positions according to your trading strategy.
- Ensure your stop placement respects the ATR line for consistent risk management.
Stop Loss
- Set stop losses directly according to the ATR line for each trade.
- Red line for buy trades, blue line for sell trades.
- Adjust based on market volatility and your personal risk level.
- Trailing stops can be applied in combination with the ATR line if desired.
Take Profit
- Take profit is defined according to your own trading strategy.
- The ATR Stop Loss Line only provides suggested stop levels, not exit targets.
- Consider using support/resistance or risk-to-reward ratios for profit targets.
- Scale out partially at important price levels if preferred.
ATR Stop Loss Line MT5 Strategy with Indicator Arrows Alert
This strategy combines the ATR Stop Loss Line Forex Indicator with the Indicator Arrows Alert to create a practical trailing stop loss system for day trading and short-term swing setups.
The arrows provide clear entry signals, while the ATR stop loss line dynamically adjusts to market volatility and helps manage risk effectively.
The core idea is to let the market guide your stop placement instead of using fixed levels.
The ATR-based line adapts as price moves, which allows trades to breathe while still protecting capital.
This approach helps traders stay in winning trades longer and exit when momentum fades.
This strategy works well on M15, M30, and H1 timeframes.
It suits traders who want a structured method for both entry and trade management without overcomplicating their decisions.
Buy Entry Rules
- Wait for a green arrow from the Indicator Arrows Alert, confirming a buy signal.
- Enter a buy trade at the close of the signal candle.
- Check the red ATR stop loss line below the current price and use it as the initial stop loss level.
- As price moves upward, trail the stop loss along the red ATR line as it adjusts.
- Close the trade when a red arrow appears or when price breaks below the ATR stop line.
- You can also secure profits near resistance levels.
Sell Entry Rules
- Wait for a red arrow from the Indicator Arrows Alert, confirming a sell signal.
- Enter a sell trade at the close of the signal candle.
- Check the blue ATR stop loss line above the current price and use it as the initial stop loss level.
- As price moves downward, trail the stop loss along the blue ATR line as it follows price.
- Close the trade when a green arrow appears or when price breaks above the ATR stop line.
- You can also exit near support zones.
Case Study 1: EURCHF M30
On the EURCHF M30 chart, a green arrow appeared after a period of consolidation, signaling a potential upward move.
A buy trade was opened at the close of the signal candle.
The red ATR stop loss line was positioned below price and used as the initial risk level.
As price continued to rise, the ATR line gradually moved upward, allowing the stop loss to trail behind the trend.
Price maintained steady bullish momentum for several candles.
The trade was exited when price dropped below the ATR line, indicating a bearish trend reversal.
Case Study 2: NZDUSD H1
On the NZDUSD H1 chart, a red arrow appeared after a failed bullish attempt, indicating a potential bearish move.
A sell trade was taken at the close of the signal candle.
The blue ATR stop loss line above price served as the initial stop placement.
As price declined, the ATR line adjusted lower, allowing the stop to follow the move without being too tight.
The market moved downward with small pullbacks, offering a smooth trend.
The short position was exited when price broke above the ATR line, capturing 43 pips.
Download Now
StopATR_auto.mq5 Indicator (MT5)
FAQ
Can this indicator be used on all timeframes?
Yes, it works on every timeframe from M1 to daily charts, automatically adjusting the stop levels based on price volatility.
How does the ATR line adjust to market volatility?
The stop lines are calculated using the ATR value, which expands in volatile markets and contracts in calm conditions, keeping stops adaptive to current price movement.
Can I modify the ATR period or target distance?
Yes, both the ATR period and target input can be customized to align with your trading style and desired stop distance.
Should I use this indicator alone?
No, it is recommended to combine the ATR Stop Loss Line with your existing strategy or system. It enhances risk management but does not generate buy or sell signals.
Summary
The ATR Stop Loss Line Indicator provides dynamic stop levels for both buy and sell trades, making risk management easier and more consistent.
Its adaptive lines adjust automatically with market volatility.
Customizable ATR period and target distance make it versatile for any trading style or instrument.
While it doesn’t produce entry signals, it complements existing strategies by helping traders protect profits and limit losses effectively.





