About the Chandelier Exit Indicator
The Chandelier Exit Indicator for MT5 helps traders define trend direction and optimal entry and exit levels by using ATR-based trailing logic.
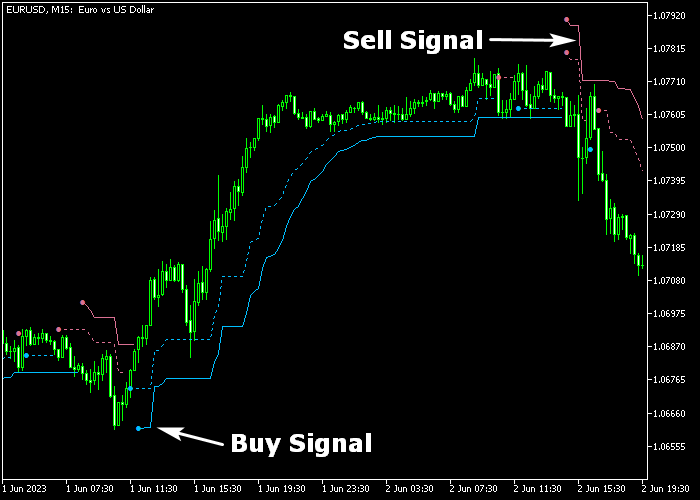
The indicator plots blue and red signal lines directly on the main price chart.
Blue lines indicate bullish momentum, while red lines indicate bearish pressure.
These signals make trend identification and trade timing straightforward.
Key adjustable parameters include range period, shift, ATR period, and ATR multiplier.
Traders can fine-tune these settings to adapt to different currency pairs and timeframes.
This tool is ideal for swing, intraday, and trend-following strategies.
Practicing on a demo account first helps understand its responsiveness to various market conditions.
Free Download
chandelier_exit.mq5 Indicator (MT5)
Key Features
- Displays dynamic cloud zones for trend direction.
- Uses ATR-based trailing levels for entry and exit points.
- Customizable range period, ATR period, and multiplier.
- Visualizes trend continuation and reversal zones on the main chart.
Indicator Chart
The Chandelier Exit Indicator overlays colored clouds directly on the main price area.
Blue lines appear when the trend is bullish and indicate potential buy opportunities.
Red lines appear when the trend is bearish, showing potential sell opportunities.

Guide to Trade with the Chandelier Exit Indicator
Buy Rules
- Wait for the blue line to appear on the chart.
- Confirm that the overall market trend supports bullish momentum.
- Enter a buy trade at the next candle open.
- Avoid buying during immediate resistance or after extended price spikes.
Sell Rules
- Wait for the red line to appear on the chart.
- Confirm that the market trend aligns with bearish momentum.
- Open a sell trade at the next candle open.
- Avoid selling near strong support or during low volatility periods.
Stop Loss
- For buy trades, place the stop loss slightly below the most recent swing low.
- For sell trades, place the stop loss slightly above the most recent swing high.
- Alternatively, use a multiple ATR-based stop to account for market volatility.
Take Profit
- Close buy trades when the colored line changes to red.
- Close sell trades when the line changes to blue.
- Optionally, scale out profits gradually if price approaches key support or resistance levels.
Chandelier Exit and Harami Pattern MT5 Trend Scalping Strategy
This scalping strategy blends dynamic trend direction with candlestick reversal signals to capture quick intraday moves.
It uses the Chandelier Exit Forex Indicator to define trend direction and manage stop loss placement and the Harami Pattern Indicator to time precise entries within that trend.
This approach allows traders to enter trades with trend alignment while keeping risk controlled and exiting efficiently.
This strategy works well on M5 and M15 charts during active sessions like London and New York.
It is ideal for major currency pairs that respond well to trend momentum and reversal patterns.
By combining trend confirmation with reversal timing, you can capture small but consistent scalp gains with disciplined risk management.
Buy Entry Rules
- Confirm that the Chandelier Exit line is blue, indicating a bullish trend.
- Wait for a blue upward arrow from the Harami Pattern indicator below a candle.
- Enter a buy trade at the close of the signal candle when both conditions align.
- Place the initial stop loss just below the blue Chandelier Exit line or below the recent swing low.
- Trail the stop loss below the blue Chandelier Exit line as price moves in your favor.
- Take profit when a magenta Harami downward arrow appears or price clearly loses bullish momentum.
Sell Entry Rules
- Confirm that the Chandelier Exit line is red, signaling a bearish trend.
- Wait for a magenta downward arrow from the Harami Pattern indicator above a candle.
- Enter a sell trade at the close of the signal candle when both signals align.
- Place the initial stop loss just above the red Chandelier Exit line or above the recent swing high.
- Trail the stop loss above the red Chandelier Exit line as price moves in your favor.
- Take profit when a blue Harami upward arrow appears or momentum clearly shifts upward.
Case Study 1: EUR/JPY M5 Trend Scalping
During an active London session, EUR/JPY showed a clear upward bias with the Chandelier Exit line turning blue on the M5 chart.
After a small retracement, a blue Harami upward arrow appeared below the candle, signaling a potential entry in the direction of the trend.
A buy trade was placed at the close of the signal candle, with the stop loss set just below the blue Chandelier Exit line.
Price resumed higher momentum, and the trailing stop was moved upward beneath the Chandelier line as price advanced.
The position was closed when a magenta Harami downward arrow appeared, locking in a strong scalp gain without waiting for major resistance.
Case Study 2: GBP/USD M15 Reversal Scalping
On the M15 timeframe during the New York session, GBP/USD displayed a downward bias with the Chandelier Exit line red.
After a minor bounce, a magenta Harami downward arrow formed above a candle, signaling a bearish entry within the trend.
A sell trade was entered at the signal candle close, with the stop loss placed just above the red Chandelier Exit line.
Price moved downward steadily, and the trailing stop was tightened above the red line as momentum continued.
The short trade was exited when a blue Harami upward arrow appeared, capturing a solid scalp move before price retraced.
Download Now
chandelier_exit.mq5 Indicator (MT5)
FAQ
How does the Chandelier Exit indicator define trends?
Trend direction is determined by the color of the line.
Can I adjust the sensitivity of the clouds?
Yes. Adjusting the range period, ATR period, and ATR multiplier changes how tight or loose the cloud follows price.
Is this indicator suitable for intraday trading?
Yes. It works well on multiple timeframes, including intraday charts, for trend identification and dynamic exit placement.
Summary
The Chandelier Exit Indicator offers dynamic cloud zones to guide both entries and exits based on ATR-based trailing logic.
Adjustable parameters let traders tailor responsiveness to different instruments and timeframes.
This indicator supports swing and intraday strategies by highlighting trend continuation and reversal points.
Its visual clarity reduces guesswork, making it easier to manage positions effectively.
By monitoring cloud shifts, traders can anticipate reversals while maintaining an adaptive risk approach.


