
About the Kaufman Adaptive Moving Average Indicator
The Kaufman Adaptive Moving Average Indicator for MT5, also known as KAMA, is a trend-following tool that adjusts its sensitivity based on market conditions.
Unlike traditional moving averages, it speeds up during strong trends and slows down during ranging periods.
This adaptive behavior helps filter out market noise while staying responsive to meaningful price movement.
When price trades above KAMA, the market bias is considered bullish. When price trades below KAMA, the bias shifts to bearish.
Traders can modify inputs such as period, applied price, colors, and line style.
Many use KAMA as part of a crossover strategy by combining short-term and long-term periods to define trend direction and entry timing.
Free Download
Key Features
- An adaptive moving average that reacts to market efficiency.
- Reduces noise during sideways conditions.
- Accelerates during strong directional moves.
- Useful for crossover-based strategies.
- Customizable period and applied price input.
Indicator Chart
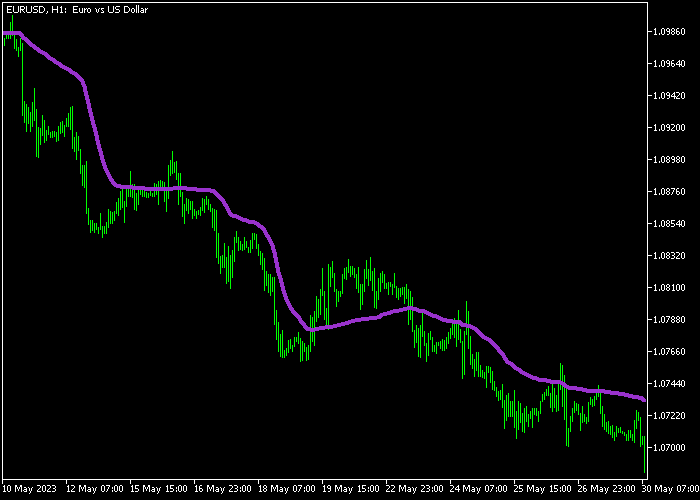
The Kaufman Adaptive Moving Average Indicator is plotted directly on the main price area as a smooth dynamic line.
When price remains above the line, bullish pressure dominates. When price stays below it, bearish conditions prevail.
In a dual KAMA setup, crossovers between short-term and long-term lines highlight potential entry points.
Guide to Trade with the Kaufman Adaptive Moving Average Indicator
Buy Rules
- Apply two KAMA lines to the price area, one short-term and one long-term.
- Use settings such as period 5 for the short-term and period 100 for the long-term line.
- Enter a buy trade when the short-term KAMA crosses above the long-term KAMA.
- Confirm that price is holding above both lines after the crossover.
Sell Rules
- Keep the same dual KAMA setup active on the price area.
- Wait for the short-term KAMA to cross below the long-term KAMA.
- Open a sell trade once the bearish crossover is completed.
- Ensure price remains below both lines to validate downside pressure.
Stop Loss
- Place the stop loss below the recent swing low for buy trades.
- Place the stop loss above the recent swing high for sell trades.
- Alternatively, position the stop beyond the long-term KAMA line.
- Keep risk consistent with your predefined money management rules.
Take Profit
- Close the buy trade when the short-term KAMA crosses back below the long-term KAMA.
- Close the sell trade when the short-term KAMA crosses back above the long-term KAMA.
- Optionally secure profits at a fixed risk to reward ratio.
Kaufman Adaptive Moving Average Scalping Strategy for MT5
This scalping strategy combines the Kaufman Adaptive Moving Average with the Brain Trend Signal Alert Indicator to create a fast and responsive trading method.
The Kaufman Adaptive Moving Average adjusts its sensitivity based on volatility, helping it stay smooth during choppy conditions and react quickly during strong moves.
This makes it highly effective for scalping where timing and precision matter.
The Brain Trend Signal provides clear arrow signals, making entries simple and visual.
This strategy is designed for M1 to M5 timeframes and works best during active sessions like London and New York.
Buy Entry Rules
- Wait for the Kaufman Adaptive Moving Average to slope upward clearly.
- Look for a blue arrow signal from the Brain Trend Signal Alert indicator.
- Enter a buy trade at the close of the signal candle.
- Place the stop loss a few pips below the Kaufman line or below the most recent minor pullback.
- Take profit when an opposite red arrow appears or when the KAMA starts flattening.
Sell Entry Rules
- Wait for the Kaufman Adaptive Moving Average to slope downward clearly.
- Look for a red arrow signal from the Brain Trend Signal Alert indicator.
- Enter a sell trade at the close of the signal candle.
- Place the stop loss slightly above the Kaufman line or above a recent micro resistance area.
- Take profit when a blue arrow appears or when the KAMA begins to lose its downward angle.
Case Study 1: EURUSD M1 Scalping Buy
During the London open on EURUSD M1, price started forming higher lows and the Kaufman Adaptive Moving Average turned upward with a steady slope.
Shortly after, a blue arrow appeared from the Brain Trend Signal indicator, signaling a potential entry.
A buy trade was executed at the candle close.
Instead of using a wide stop, the stop loss was placed just under the Kaufman line, keeping risk tight.
Price reacted quickly and moved upward in a short burst, following the direction of the trend.
The long trade was closed when a red arrow appeared, indicating a possible shift.
Case Study 2: GBPUSD M5 Scalping Sell
On GBPUSD M5 during the New York session, price showed a clear downward structure with lower highs forming.
The Kaufman Adaptive Moving Average sloped downward, confirming bearish conditions.
A red arrow signal appeared after a small pullback.
A sell trade was taken at the candle close.
This time, the stop loss was placed above a recent consolidation high instead of directly near the indicator, giving the trade more breathing room.
Price moved lower with momentum and respected the downward slope of the KAMA.
The short trade was exited when a blue arrow appeared and the moving average started to flatten, signaling a slowdown.
Download Now
FAQ
What makes KAMA different from a simple moving average?
KAMA adjusts its speed according to market volatility and efficiency.
It becomes more responsive in trending markets and smoother during consolidation phases.
Which periods are commonly used for crossover strategies?
A common combination is period 5 for the short-term line and period 100 for the long-term line.
Traders can adjust these values depending on timeframe and volatility.
Is KAMA suitable for ranging markets?
It performs better in trending environments.
During sideways markets, signals may occur less frequently, but the adaptive calculation helps reduce whipsaws.
Can KAMA be combined with other indicators?
Yes, many traders combine it with momentum oscillators or support and resistance analysis to strengthen trade confirmation.
Summary
The Kaufman Adaptive Moving Average Indicator provides a flexible and intelligent approach to trend analysis.
Its adaptive calculation allows it to follow strong moves while filtering unnecessary noise.
When used in a crossover setup, KAMA delivers structured entry and exit signals that align with prevailing momentum.


