About the All In One Pivot Points Indicator
The All In One Pivot Points Indicator for MT5 automatically plots the daily pivot point along with key support and resistance levels directly on your chart.
It calculates the pivot point, S1, S2, S3, R1, R2, and R3 levels for the upcoming trading day.
These levels act as potential reversal zones, breakout areas, and profit targets.
When price trades above the daily pivot point, market sentiment is considered bullish.
When price trades below it, bearish pressure dominates.
This simple rule helps traders quickly determine directional bias.
You can customize the calculation method, time period, number of levels, colors, and line style to match your strategy and visual preferences.
Free Download
PivotPoints.All-In-One.mq5 Indicator (MT5)
Key Features
- Automatically calculates daily pivot levels.
- Displays PP, S1, S2, S3 and R1, R2, R3.
- Supports multiple pivot calculation methods.
- Fully customizable colors and line styles.
- Adjustable calculation period and number of levels.
- Works on all MT5 instruments.
- Helps define daily bullish or bearish bias.
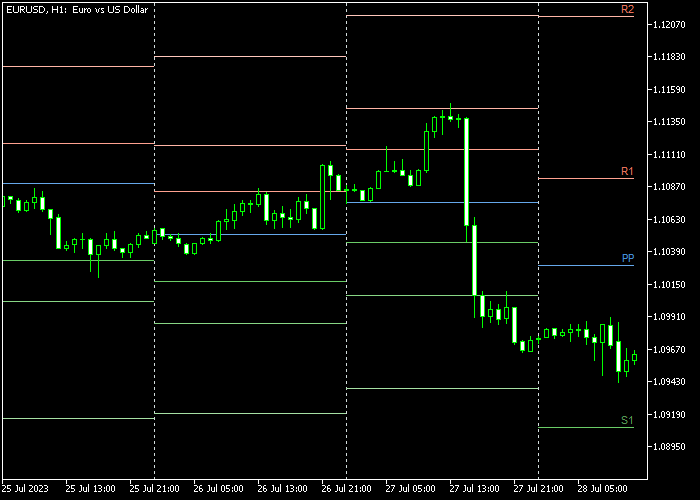
Indicator Chart
The All In One Pivot Points Indicator plots the central pivot point in blue along with clearly marked support and resistance levels.
On the example setup, price reacts around the pivot line and often pauses or reverses at S1 and R1.
Breakouts beyond R2 or S2 usually indicate stronger momentum for the session.

Guide to Trade with All In One Pivot Points Indicator
Buy Rules
- Wait for a candle to close above the blue pivot point from below.
- Confirm that price holds above the pivot on the next candle.
- Enter a buy trade after bullish confirmation.
- Avoid buying directly below strong resistance such as R2 or R3.
Sell Rules
- Wait for a candle to close below the blue pivot point from above.
- Confirm that price holds below the pivot on the next candle.
- Enter a sell trade after bearish confirmation.
- Avoid selling directly above strong support such as S2 or S3.
Stop Loss
- Place a protective stop a few pips below the S1 level for buy trades.
- Place a protective stop a few pips above the R1 level for sell trades.
- For breakout trades, set the stop just beyond the opposite side of the pivot.
- Adjust lot size to maintain a consistent risk percentage per trade.
Take Profits
- Target R1, R2, or R3 for buy trades.
- Target S1, S2, or S3 for sell trades.
- Close the position partially at the first level and trail the rest.
- Exit early if the candlestick closes back across the pivot point.
Pivot Points Universal Oscillator Scalping Strategy MT5
This scalping strategy combines price-level confirmation with momentum signals by using the All-in-One Pivot Points Forex Indicator for MT5 and the Universal Forex Oscillator for MT5.
It is designed for short-term trades on M1 and M5 timeframes, focusing on fast entries with high probability setups.
The Pivot Points Indicator provides clear market bias.
When the price is above the pivot level, it signals bullish conditions suitable for buy trades.
When the price is below the pivot level, it indicates bearish conditions, guiding sell trades.
The Universal Forex Oscillator adds precise timing for entries. A blue histogram bar signals a buy opportunity, while a red histogram bar signals a sell opportunity.
Combining pivot-based trend direction with momentum-based signals increases the likelihood of successful scalping trades.
Buy Entry Rules
- Confirm that the price is above the pivot point, indicating bullish conditions.
- Wait for a blue histogram bar from the Universal Forex Oscillator.
- Enter a buy trade immediately after the histogram confirms momentum.
- Place stop loss below the nearest pivot support or recent swing low.
- Close the trade fully when a red histogram bar appears or when price drops below the pivot.
Sell Entry Rules
- Confirm that the price is below the pivot point, indicating bearish conditions.
- Wait for a red histogram bar from the Universal Forex Oscillator.
- Enter a sell trade immediately after the histogram confirms momentum.
- Place stop loss above the nearest pivot resistance or recent swing high.
- Close the trade completely when a blue histogram bar appears or when price rises above the pivot.
Case Study 1: EURUSD Buy Trade
On the M1 timeframe during the London session, price stayed above the pivot point, confirming bullish bias.
Shortly after, the Universal Forex Oscillator displayed a blue histogram bar.
A buy trade was entered immediately after the signal. Price moved upward quickly with momentum.
The trade was closed when a red histogram bar appeared, securing 13 pips.
Case Study 2: USDJPY Sell Trade
On the M5 timeframe during the New York session, price remained below the pivot point, confirming bearish conditions.
Shortly after, the Universal Forex Oscillator showed a red histogram bar.
A sell trade was executed immediately after the signal. Price declined steadily in line with market bias.
The position was closed when a blue histogram bar appeared, capturing 23 pips.
Download Now
PivotPoints.All-In-One.mq5 Indicator (MT5)
FAQ
Which pivot calculation method should I use?
The classic method is widely used and works well for most traders.
However, you can test Fibonacci or Camarilla methods to match your strategy.
Can I use this indicator for scalping?
Yes. Many scalpers use pivot levels on lower timeframes to identify intraday reversals and breakout zones.
Do pivot levels work on all instruments?
Yes. The indicator supports Forex pairs, indices, commodities, and other MT5 instruments.
What happens if price stays around the pivot?
When price consolidates near the pivot, it often signals indecision.
In such cases, wait for a confirmed breakout before entering a trade.
Summary
This technical tool provides a structured way to trade daily support and resistance levels.
By automatically plotting pivot points and key price zones, it simplifies intraday decision-making.
It helps traders define directional bias quickly and identify realistic profit targets.
With customizable settings and broad market compatibility, it fits both scalpers and day traders.
Used with proper risk management and confirmation, pivot levels can become a reliable foundation for consistent trading decisions.