About the Fibo Pivots Indicator
The Fibo Pivots Indicator for MT5 uses Fibonacci calculations to plot pivot points along with three support and three resistance levels directly on the main price area.
These levels act as reference points for trend direction, trade entries, and exit targets.
Price above the central Fibonacci pivot line is generally bullish, while price below it is bearish.
The three support levels are highlighted in orange and the three resistance levels in blue.
Traders often use these lines for stop loss placement and take profit objectives.
Input parameters such as line colors and styles can be customized to suit individual chart preferences.
Free Download
Fibo pivots.mq5 Indicator (MT5)
Key Features
- Plots a central Fibonacci pivot line with 3 support and 3 resistance levels.
- Price above pivot indicates bullish bias, below pivot indicates bearish bias.
- Orange lines mark support zones, blue lines mark resistance zones.
- Supports stop loss and take profit placement based on pivot levels.
- Customizable colors and line styles for clarity.
- Applicable to forex, indices, metals, and other MT5 instruments.
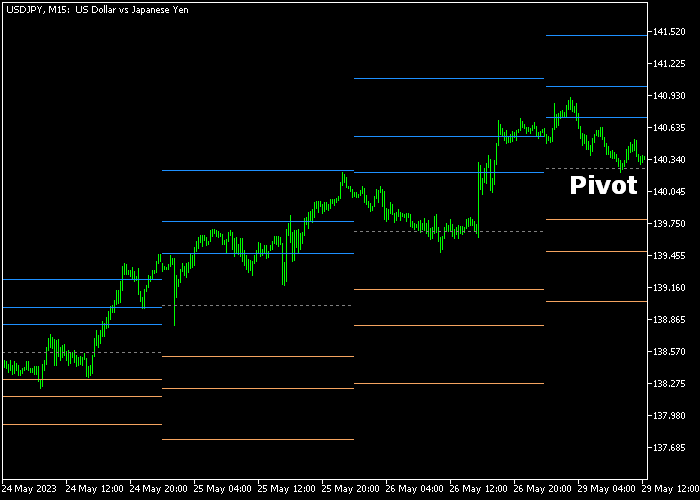
Indicator Chart
The Fibo Pivots Indicator shows a gray dotted central pivot line, three orange support lines, and three blue resistance lines beneath or above the price candles.
Price movement relative to these levels highlights market bias and potential reversal points.
Traders can see where bullish or bearish momentum may encounter obstacles or support.
Guide to Trade with Fibo Pivots Indicator
Buy Rules
- Wait for a candle to close above the gray dotted Fibonacci pivot line from below.
- Enter a buy trade at the close of the bullish candle.
- Confirm that price is holding above the pivot line for trend confirmation.
- Look for momentum continuation before adding additional positions.
Sell Rules
- Wait for a candle to close below the gray dotted Fibonacci pivot line from above.
- Open a sell trade at the close of the bearish candle.
- Ensure price remains below the pivot line to validate downside bias.
- Check that selling pressure is consistent before scaling in.
Stop Loss
- For buy trades, place the stop below the nearest or most relevant orange support line.
- For sell trades, place the stop above the nearest blue resistance line.
Take Profit
- Exit buy trades at any of the blue resistance lines for reward targets.
- Exit sell trades at any of the orange support lines for reward targets.
- Close fully once momentum shows signs of reversal or exhaustion.
Fibo Pivots and Trend Rider Day Trading Strategy for MT5
This day trading strategy combines the Fibo Pivots Indicator with the Trend Rider Indicator to build a clear and reactive approach for intraday trading.
It identifies directional bias using pivot levels and timing entries with momentum-based candle signals.
The Fibo Pivots indicator plots key support and resistance levels using Fibonacci calculations, helping traders quickly identify whether the market is trading in a bullish or bearish environment.
The Trend Rider indicator adds confirmation through color-coded candles.
Green candles highlight upward momentum while red candles signal bearish pressure.
This allows traders to align entries with both structure and momentum.
This strategy is built for M5 and M15 charts and works best during London and New York sessions when volatility supports clean intraday moves.
Buy Entry Rules
- Wait for price to close above the gray dotted Fibonacci pivot line, confirming a bullish bias.
- Look for a green candle from the Trend Rider indicator.
- Enter a buy trade at the close of the green candle.
- Place the stop loss below the pivot line or below the nearest support level such as S1.
- Take profit near the next resistance level like R1 or R2, or exit if a red candle appears.
Sell Entry Rules
- Wait for price to close below the gray dotted Fibonacci pivot line, confirming a bearish bias.
- Look for a red candle from the Trend Rider indicator.
- Enter a sell trade at the close of the red candle.
- Place the stop loss above the pivot line or above the nearest resistance level such as R1.
- Take profit near the next support level like S1 or S2, or exit if a green candle appears.
Case Study 1: EURUSD M5 Intraday Trend Continuation
During the London session on EURUSD M5, price opened above the Fibonacci pivot line and continued holding above it.
This established a bullish environment. After a brief pullback, a green candle appeared from the Trend Rider indicator, signaling renewed buying pressure.
A buy trade was taken at the close of that candle.
Instead of placing the stop too tightly, it was set just below the pivot line which acted as dynamic support.
Price moved steadily upward toward the R1 level, maintaining bullish structure throughout the move.
The long trade was closed as price approached resistance and momentum began to slow with smaller candles forming.
Case Study 2: GBPJPY M15 Bearish Intraday Move
On GBPJPY M15 during the New York session, price dropped below the Fibonacci pivot line and remained below it, confirming bearish conditions.
A red candle from the Trend Rider indicator appeared after a minor upward retracement.
A sell trade was entered at the close of the red candle.
The stop loss was placed above the recent pullback high rather than directly at the pivot, giving the trade more room to develop.
Price continued downward toward the S1 level with consistent bearish candles.
The short trade was exited when a green candle appeared, indicating that selling pressure was fading.
Download Now
Fibo pivots.mq5 Indicator (MT5)
FAQ
How are the pivot points calculated?
The central pivot is based on Fibonacci calculations using recent price highs, lows, and closes.
Support and resistance levels are derived as proportional extensions from this pivot.
Can this indicator be used for intraday trading?
Yes, it works effectively on short-term charts like M15 or H1 as well as higher timeframes for swing trading.
How can I reduce false signals?
Confirm pivot breakouts with momentum indicators or trend filters. Trading only in the direction of the broader trend reduces false entries.
Summary
The Fibo Pivots Indicator provides a clear framework for tracking potential reversal points and key levels in the market.
Its combination of pivot, support, and resistance lines makes trade planning and risk management easier.
Traders can improve timing and manage risk by trading breakouts or pullbacks relative to these levels.
Using disciplined stop loss and take profit placement helps capture moves in both trending and range-bound markets.